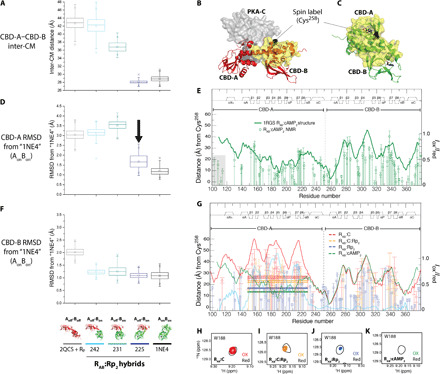
Fig. 4. RAB interdomain interactions probed through MD simulations and PREs.

(A) Simulated CM distances between CBD-A and CBD-B for RAB:Rp2 in the Aoff-Boff, AonBon, and hybrid Aoff-Bon models with three different A/B boundaries (i.e., residues 242, 231, and 225, as shown in the bottom of F). (B and C) PRE design. The spin label is at Cys258 in CBD-B. Yellow surfaces are within 25 Å of the spin label. In C-bound (cAMP2-bound) RAB, interdomain interactions are minimal (maximal). (D) CBD-A RMSD versus AonBon. The closed topology induces the Aoff-Bon ➔ AonBon transition (black arrow). (E) PRE control. The Iox/Ired ratios (green circles) track the distance from the spin label (dark green line). Deviations occur in dynamic regions, e.g., flexible linker (gray highlight) (20, 38). (F) As (D), but for CBD-B. (G) Iox/Ired ratios for the RAB:C (red), RAB:C:Rp2 (orange), and RAB:Rp2 (blue) complexes. Dashed lines indicate the average Iox/Ired ratio for the region with the largest 2QCS (red) versus 1RGS (green) difference (cyan) in distance from the spin label. Solid lines mark the respective average ±1 SD. (H to K) Representative HN TROSY cross-peaks of oxidized and reduced samples. Contour levels were adjusted according to the intensity normalization as per Materials and Methods to account for aggregation.
