
Fig. 2. Neural representation of our computational model’s anticipatory utility signal in the vmPFC.
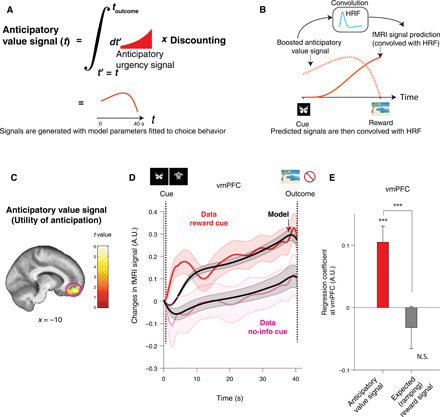
(A) The anticipatory utility signal at time t is an integral of discounted future anticipation (urgency signal) at t′ > t (red curve). This signal is different from a well-studied expected value of future reward, which we included in the same GLM. (B) The model’s prediction for fMRI signals (solid red) is computed by convolving the model’s signal (dotted red) with a canonical HRF (light blue). (C) BOLD in vmPFC positively correlated with an anticipatory utility signal. This survived our phase-randomization test (whole-brain FWE P < 0.001; see fig. S8) and SPM’s standard whole-brain FWE (P < 0.05). A cluster surrounding the peak [10,50,16] (cFWE, P < 0.05 with height threshold at P < 0.001) is shown for display purposes. (D) The temporal dynamics of the BOLD signal in the vmPFC [shown in (C)] matched the model’s anticipatory utility signal during the anticipation period. Changes in activity following receipt of a reward predictive cue (red) and a no-information cue (magenta), as well as the model’s prediction for each of these conditions (black) are shown. The error bar indicates the SEM over participants. (E) A confirmatory analysis shows that activity in vmPFC is more strongly correlated with our model’s anticipatory utility signal than an expected reward value signal. The average regression weights in the vmPFC for the anticipatory utility signal were significantly greater than the expected reward signal (***P < 0.001, permutation test). The former was also significantly larger than zero (***P < 0.001, t test, t38 = 4.07), but the latter was not. The error bars indicate the mean and SEM. A.U., arbitrary units; N.S., not significant.