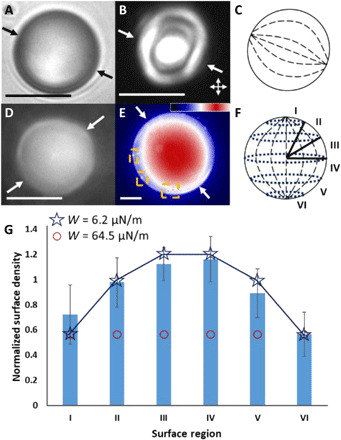
Fig. 1. Bipolar LC microparticles, experiments, and theoretical predictions.

Representative (A) bright-field and (B) polarized light micrographs (double-headed arrows show orientations of polarizers) of a polymerized bipolar LC microparticle. (C) Illustration of the internal ordering of the microparticle in (A) and (B). (D) Fluorescence micrograph of a polymerized bipolar microparticle in the presence of probe PS colloids but no added NaCl and (E, colorized) in the presence of probe colloids and 10 mM aqueous NaCl. Orange boxes highlight the location of four in-focus adsorbed probe colloids. (E) Inset: Lookup table (LUT) for the colorized fluorescence micrograph (ImageJ, “UnionJack”). (F) Microparticle surface regions used to classify probe colloid locations on the surfaces of polymerized bipolar microparticles. (G) Blue bars: Normalized surface densities of probe colloids measured to adsorb onto the surfaces of polymerized bipolar microparticles. The bipolar microparticle data were calculated from 11 independent experiments, with 84 polymerized LC microparticles and 952 probe colloids adsorbed onto the surfaces of these microparticles. The error bars are 95% confidence intervals on the averages for the 84 microparticles. (stars and circles) Theoretical predictions of adsorbed colloid densities on the surfaces of bipolar microparticles, with indicated tangential anchoring strength. The white single-headed arrows on micrographs indicate the locations of the surface defects. Scale bars, 15 μm (λex = 505 nm, λem = 515 nm).
