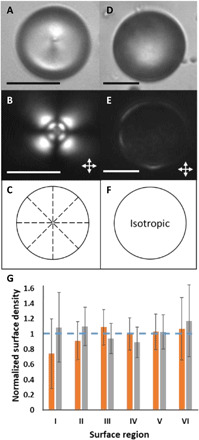
Fig. 2. Radial LC and isotropic microparticles and their characterization.

Representative (A and D) bright-field and (B and E) polarized light micrographs (double-headed arrows show orientations of polarizers) of a polymerized radial LC (A and B) and isotropic (D and E) microparticle. (C and F) Illustrations of the internal orderings of the microparticles in (A) and (B) and (D) and (E), respectively. (G) Bars: Normalized surface density of PS probe colloids adsorbed onto the surfaces of polymerized radial LC (orange) and isotropic (gray) microparticles. The radial microparticle data were calculated from 12 independent experiments, with 132 polymerized LC microparticles and 503 adsorbed probe colloids. The isotropic microparticle data were calculated from 20 independent experiments with 179 polymerized microparticles and 521 adsorbed probe colloids. The error bars are 95% confidence intervals on the averages for the 132 radial LC and 179 isotropic microparticles. The horizontal dashed line corresponds to a uniform adsorption density across all surface regions. Scale bars, 15 μm.
