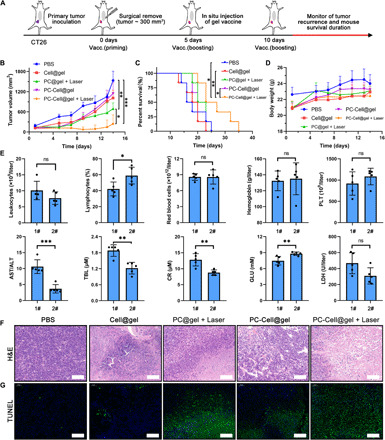
Fig. 6. Inhibiting the relapse of postoperative tumor by PC-Cell@gel.

(A) Treatment schedule in CT26 recurrent mouse tumor model. (B) Average growth kinetics of recurrent tumors after treated by different suspensions (n = 5). (C) Survival percentage of CT26 recurrent tumor-bearing mice in control and treated groups (n = 6). (D) Body weight of mice in all groups (n = 5). (E) Serological and physiological-biochemical analysis of vaccinated mice was performed at the end of study (n = 5). 1#, PBS; 2#, PC-Cell@gel + Laser. (F) Histological assessment of recurrent tumors. Scale bars, 100 μm. (G) TUNEL staining of tumor sections in all groups. Scale bars, 100 μm. Data are means ± SD. Statistical significance was calculated by one-way ANOVA with Tukey’s post hoc test and log-rank (Mantel-Cox) test (ns, no significance; *P < 0.05, **P < 0.01, ***P < 0.001).
