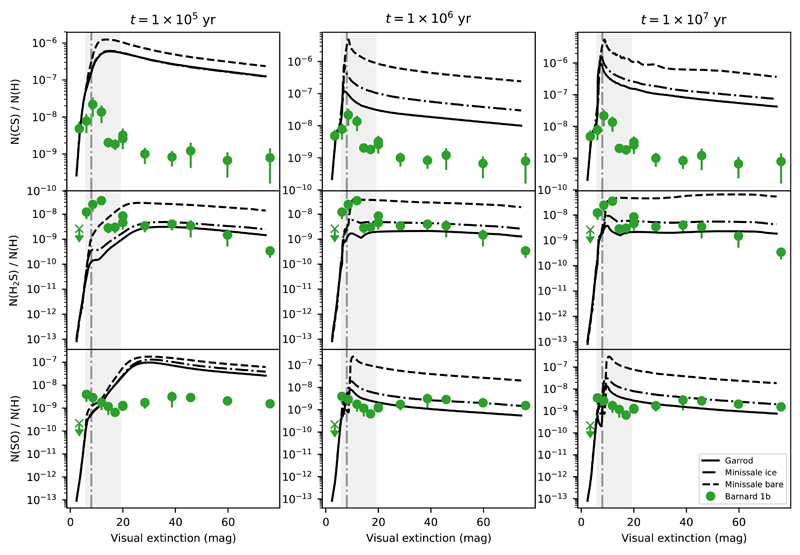
Fig. 10.
Plots that show the predicted abundances (solid lines) of the CS (top row), H2S (middle row), and SO (bottom row) by models with different chemical desorption schemes, together with the observed abundances in Barnard 1b, at times 0.1 − 1 − 10 Myrs. The vertical dashed line represents Av = 8 mag, and the shaded area encloses the range of extinctions 6 − 19 mag.

