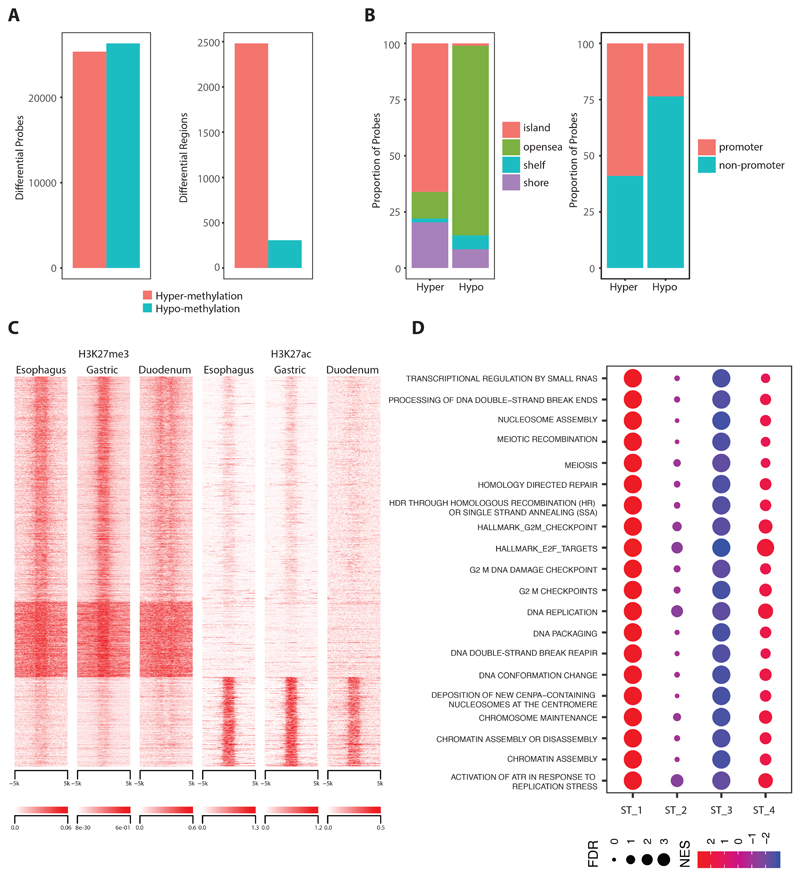
Figure 2. Hypermethylation driven Subtype 1.
a. Total number of hyper and hypomethylation events observed in Subtype 1 at individual CpG base level (left) and regions with clustered probes (right). b. Annotation of both of hyper and hypomethylation events with respect to CpG island (left) and gene promoter (right). b. Heatmap quantifying levels of H3K27me3 and H3K27ac in all extend regions undergoing hypermethylation. d. Dot plot with top scored pathways identified in Subtype 1 when compared with other subtypes through gene get enrichment analysis.

