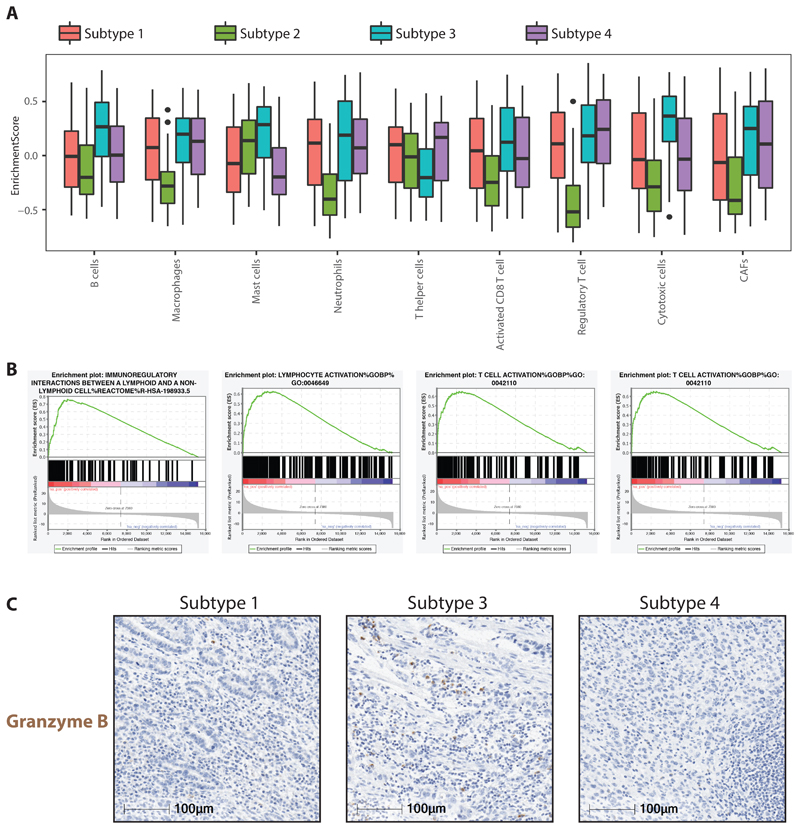
Figure 4. Immune regulated Subtype 3.
a. Boxplot displaying enrichment scores for different immune cell types computed from bulk RNA-seq data across all four different subtypes. b. Gene set enrichment plot for key immune regulated pathways identified on comparing Subtype 3 with all other Subtypes. c. IHC staining for Granzyme B on three different chemo-treated cases representative of Subtype 1,3,4.

