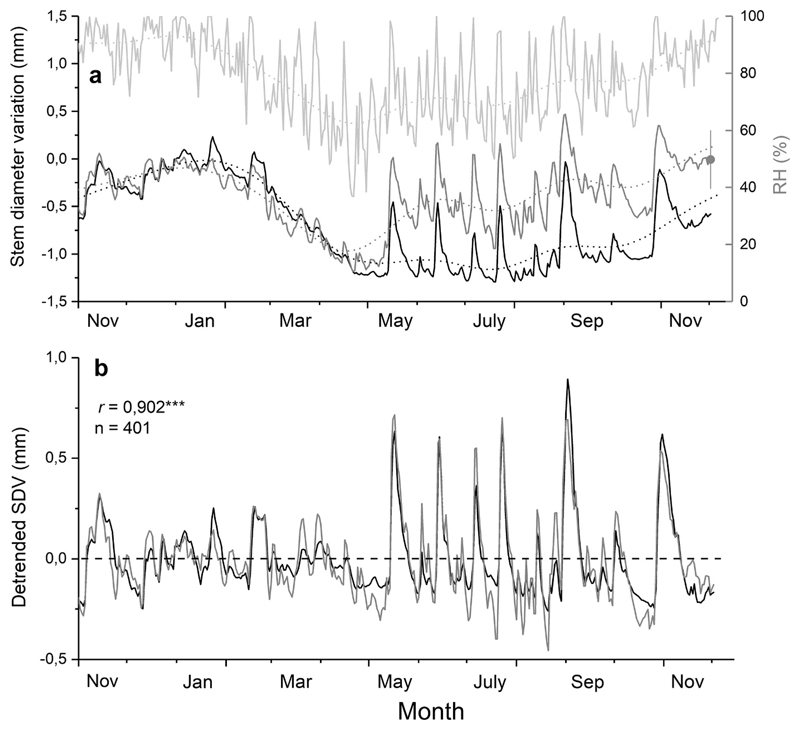
Fig. 3.
a-b Raw (a) and detrended (b) stem diameter variations (SDVs) of living mature trees (n=3; dark grey lines) and one dead mature tree (black lines) during 2018 compared to relative air humidity (RH; grey line) and precipitation (bars). Mean standard deviation (bar) among dendrometer records of living trees (grey circle) is shown. Tree death educed from 100 % needle browning occurred in October 2017. Long-term trends of daily SDVs (dotted lines) were calculated by fast Fourier transform low-pass filter (n=28). Pearson correlation coefficients (r) among detrended SDVs (dSDVs) of living and dead trees are indicated (*** = P<0.001).

