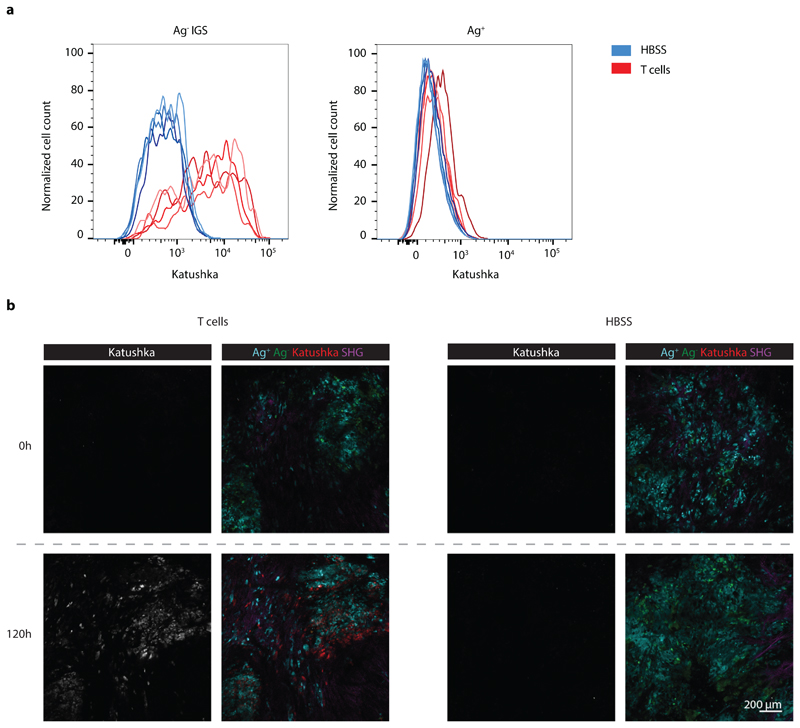
Extended Data Fig. 4. CD8+ T cell dependent Katushka signaling in IGS reporter cells in vivo.
a) Flow cytometric analysis of Katushka expression in CFP+ IGS reporter (left panel) and GFP+ Ag+ (right panel) cells derived from mixed tumors described in Fig. 2b. Data from mice treated with HBSS are depicted in blue, data from mice treated with CDK4R>L-specific CD8+ T cells are depicted in red, n=4 mice per condition, data obtained from one experiment. b) Representative images of tumors before and 120h after injection of CDK4R>L-specific CD8+ T cells (left panel, three independent experiments with n=1 mouse each) or HBSS (right panel, two independent experiments with n=1 mouse each), for the imaging experiments described in Fig. 3. SHG: Second-harmonic generation. Scale bar is 200 mm.

