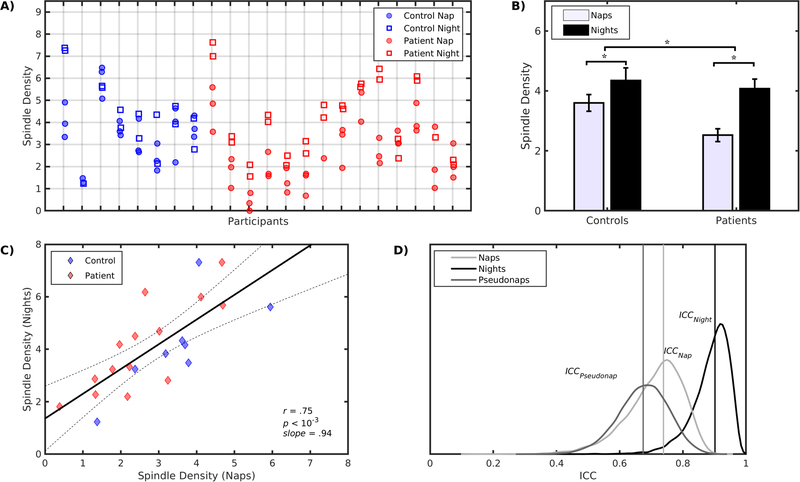
Figure 1.
A) Dot plot of spindle density for each subject during naps (circles) and nights (squares). B) Differences of spindle density between naps and nights for controls and patients. Patients showed a larger nap/night spindle density difference than controls. C) Relation of average spindle density during naps (x-axes) and nights (y-axes). The solid line is the least squares line for the combined groups and 95% confidence intervals are indicated by dotted lines. D) Spindle density reliability across naps (ICCNap), nights (ICCNight) and pseudonaps (ICCPseudonap) are indicated by vertical lines along with their bootstrap distributions.

