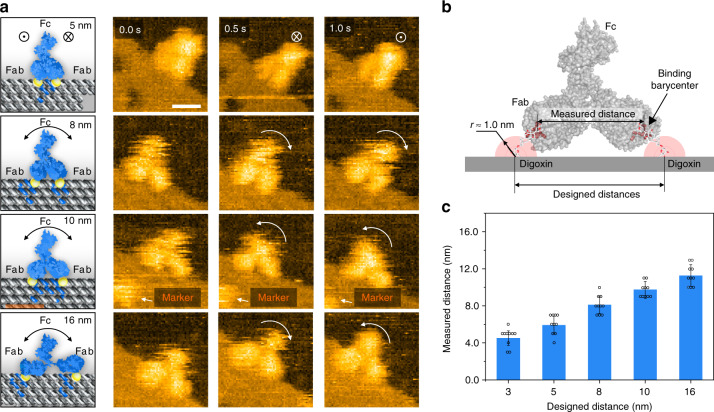
Fig. 2. HS-AFM characterization of the conformational flexibility and measured Fab–Fab distance of DOE-confined IgGs.
a Schematics representing the distinct conformations of single IgGs captured by DOEs with designed distances of 5, 8, 10, and 16 nm, respectively (left). Snapshot HS-AFM images (2 fps) of single IgGs bound to various designed lateral distances of epitopes (right). Different conformations of IgGs, and positional fluctuations of the mass barycenters of Fc domains, are observed (right, white arrows). Scale bar, 10 nm. b Schematic illustration of the measured distances between the barycenters of two Fab domains, and designed distances of paired epitopes (black lines). c Relationship between the designed digoxin distances (3, 5, 8, 10, and 16 nm) and measured distances of Fabs in IgGs (4.6 ± 1.0, 6.0 ± 1.0, 8.1 ± 1.0, 9.7 ± 0.8, and 11.3 ± 1.2 nm). Central values represent average values, and error bars represent the standard deviations, as calculated from independent experiments (n = 10). Source data are provided as a Source Data file.

