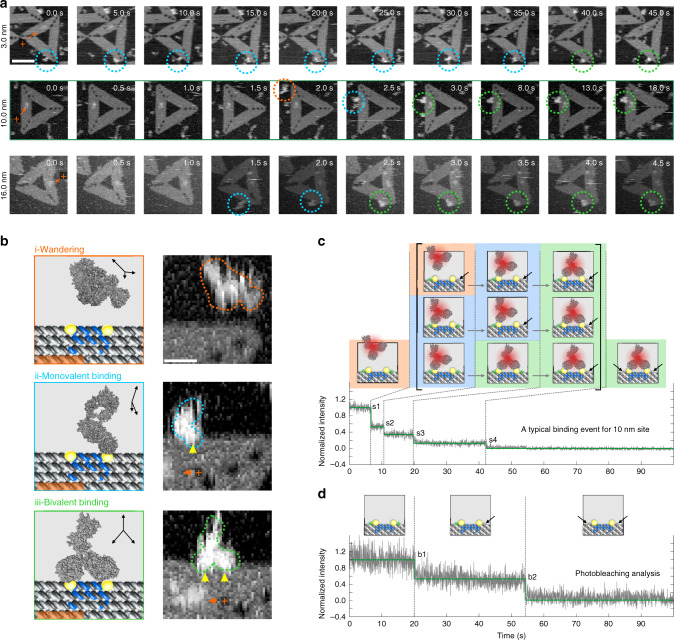
Fig. 3. Dynamics of IgG binding to DOEs.
a HS-AFM images for temporal evolution of the three-stage binding process, from wandering (orange circle) to monovalent binding (cyan circle), then bivalent binding (green circle) states for DOEs with designed distances of 3, 10, and 16 nm, respectively. Scale bar, 60 nm. b Schematic of the three-stage binding process and corresponding HS-AFM images (10-nm site: representative images of over ten independent replicates). The black arrows within each coordinate indicate the orientation of the IgG model. The dashed contours highlight the observed IgGs at different stages. The yellow arrows indicate the binding sites. The orange arrows indicate the maker, and orange plus signs represent positive orientation of DOE platform. Scale bar, 10 nm. c Exemplary single-molecule FRET trajectory (gray, raw 31.25 Hz data), and hidden Markov model fit (green) of a binding event for 10 nm site. A pair of ATTO 550 dye (donor, green dots) is labeled to the proximity of the epitopes. Alexa 647 dye (acceptor, crimson dots) is labeled on IgG. Note that two photobleaching events are inserted in the three-stage binding process observed by HS-AFM, resulted in a total five fluorescence intensity levels. The second bleaching could only occur at s4, while the first bleaching may occur at s1, s2, or s3. d Photobleaching analysis of the DOEs only system showing two-step (b1 and b2) signal drop due to the successive bleaching of two ATTO 550 dyes. Source data are provided as a Source Data file.

