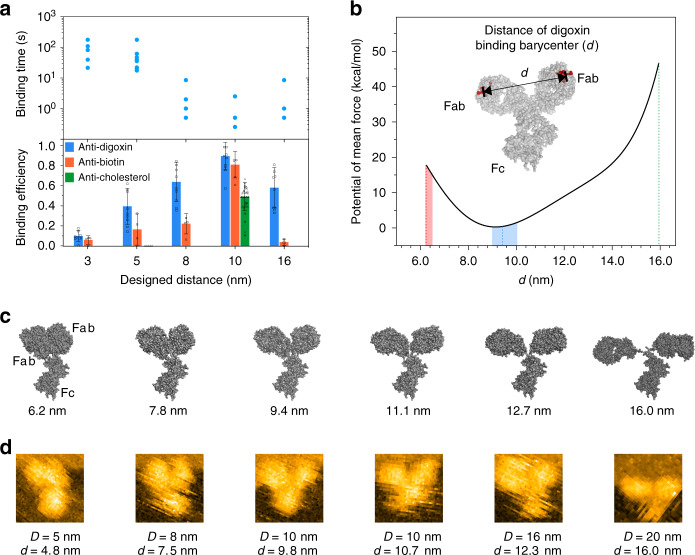
Fig. 4. Engineering DOEs for evoking the IgG avidity.
a Scatter plot for the monovalent-to-bivalent-binding transition kinetics of IgG-DOE (upper, HS-AFM), and histogram of IgG binding efficiency as a function of the designed distance on DOEs (bottom, PeakForce-AFM). The error bars represent the standard deviation, calculated from three independent experiments for each type of IgG. For the anti-digoxin, anti-biotin, and anti-cholesterol IgG types, the numbers of DNA origami used for each DOE were 252, 372, and 661, respectively. b Course-grained molecular dynamics calculations. Calculated energy diagram for IgG binding between mass barycenters at various distances. The most preferred binding site distance of IgGs was 9.5 nm. Conformations with binding site distance short or longer than 9.5 nm are all energy unfavorable. Especially, when distance longer than 15.0 nm, the potential of mean force was dramatically increased. It also implies that conformations with or close to 9.5 nm has the largest probability of occurrence. c, d Typical simulated free IgG conformations using course-grained molecular dynamics calculations and corresponding HS-AFM images for the bivalently bound IgGs on DOEs. Source data are provided as a Source Data file.

