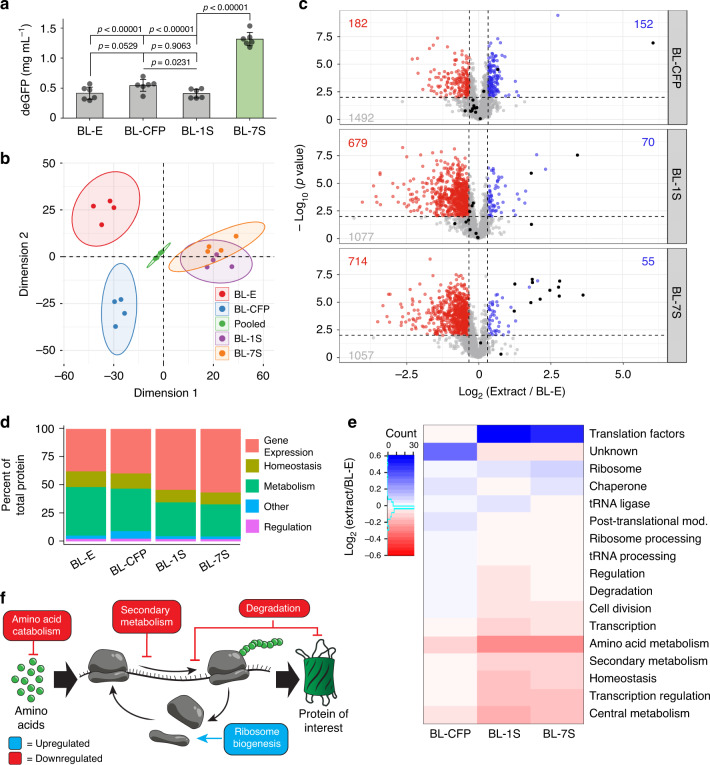
Fig. 3. Mass spectrometry reveals proteome reprogramming.
a Expression data of all extracts used in mass spectrometry analysis. Data are presented as mean values and error bars represent s.d. (n = 6 three independent reactions of two independent extract preparations). Standard two-tail t-test. b Principal component analysis showing the grouping of the various extracts based on their protein profile. Ellipses indicate the boundary for statistical significance by a two-tailed t-test (p value < 0.01). Clear grouping is observed between the replicates of each sample. c Volcano plots displaying the changes in protein intensity between each extract and the BL21(DE3) control. Red data points indicate a decrease in protein intensity greater than 25% and a p value < 0.01 from a two-sided t-test. Blue data points indicate an increase in protein intensity greater than 25% and a p value < 0.01 form a two-tailed t-test. The proteins that were intentionally overexpressed are colored black. Numerous statistically significant changes are observed, many of which are downregulated. d The sum of protein intensity in each category for each extract is presented as percentages of the total protein intensity in that extract. There is a marked increase in gene expression and a decrease in metabolism and homeostasis related proteins when comparing BL-1S and BL-7S to BL-E. e The identified proteins were further subdivided into more specific functional groups. The log difference between the protein intensity of each extract and BL-E were calculated and then averaged within each functional group and plotted on a colorimetric scale. The dendrogram represents the clustering of each protein group based on their similarity to other groups. CFP was inserted into the Unknown category. f Diagram of translation indicating the key changes in the proteome and their influence on gene expression. Source data for a–e are provided as a Source Data file. In b–e use the same samples throughout. (n = 4 two independent samples from two independent extract preparations).

