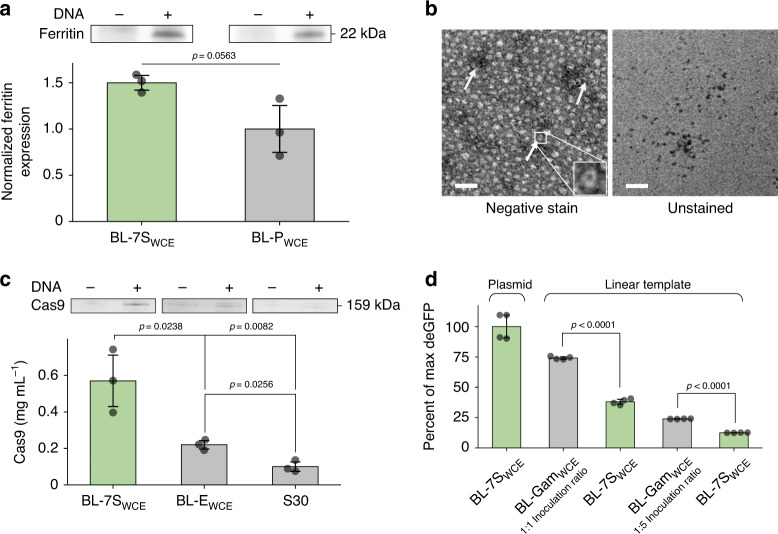
Fig. 4. Enhanced CFPS as a versatile tool for the expression of diverse proteins.
a CFPS of ferritin using BL-7SWCE and BL-PWCE. The bar chart shows that the expression of ferritin in reactions assembled using BL-7SWCE is ~0.5-fold higher than the expression achieved using BL-PWCE. Standard two-tail t-test (n = 3 independent experiments). Top panel: representative SDS-PAGE results of CFPS reactions expressing ferritin (+) and negative control without plasmid (−). See Supplementary Fig. 10. for the SDS-PAGE analysis of all the CFPS reactions. b TEM images of ferritin nanocages. The left image shows the stained samples, while the right image shows the unstained samples. In the unstained image, the iron core of the ferritin cages can be seen. White arrows indicate nanocages. See Supplementary Fig. 10 for a side by side comparison with negative controls. Three independent experiments of the assembly of ferritin nanocages and its imaging using TEM (See “Methods, Section M9”) were performed. All experiments showed the same results. Scale bar represents 100 nm. c CFPS of Cas9 using BL-7SWCE and control extracts. The bar chart shows that the expression of Cas9 in reactions assembled using BL-7SWCE is approximately three- and fivefold higher than the expression achieved using BL-EWCE and S30, respectively. See “Methods, Section M8” for details about Cas9 quantification. Standard two-tail t-test (n = 3 independent experiments). Top panel: representative SDS-PAGE results of CFPS reactions expressing Cas9 (+) and negative control without plasmid (−). See Supplementary Fig. 11. for the SDS-PAGE analysis of all the CFPS reactions. d CFPS of deGFP using linear DNA as a template. The reactions assembled using 1:1 and 1:5 inoculation ratios of BL-GamWCE and linear DNA as a template show 74% and 24% of the maximum deGFP expression respectively compared with a control assembled using BL-7SWCE and plasmid DNA as a template. These reactions exhibit up to approximately twofold higher deGFP expression than controls assembled using BL-7SWCE and linear DNA as a template. Standard two-tail t-test (n = 4 independent experiments). In a, c, d data are presented as mean values and error bars represent s.d. Source data for a, c, e are provided as a Source Data file.

