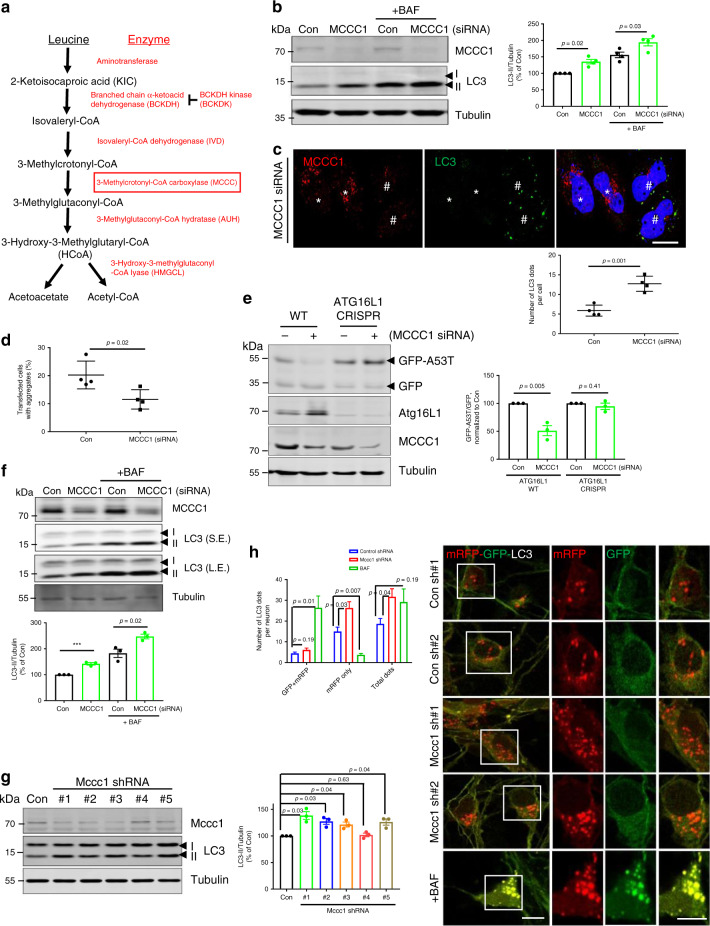
Fig. 1. MCCC1 negatively regulates autophagy.
a Leu metabolic pathway. Red box shows MCCC1 gene. b Autophagy activation by MCCC1 depletion. siRNA knockdown of MCCC1 in HeLa cells was used to determine whether MCCC1 can regulate autophagy (Con; scrambled, nontargeting siRNA, MCCC1; SMARTpool MCCC1 targeted siRNA). Blots are representative of four independent experiments (N = 4). Two-tailed unpaired t-test. c Immunostaining of HeLa cells treated with MCCC1 SMARTpool siRNA using MCCC1 (red) and LC3 (green) antibodies, nuclei are stained with DAPI (blue). #MCCC1 knockdown cells, *non-knockdown cells. Scale bar, 10 μm. N = 4; 70–80 cells scored per condition per experiment. Two-tailed unpaired t-test. d Reduced HTT (Q74) aggregation in MCCC1 knockdown HeLa cells. HeLa cells were seeded on coverslips in triplicates, transfected with siRNAs targeting control or MCCC1, followed by HA-tagged HTT (Q74) expression. N = 4, 40–60 cells scored per condition per experiment. Two-tailed unpaired t-test. e α-synuclein degradation assay in control or MCCC1 knockdown ATG16L1 WT or CRISPR KO HeLa cells. Cells were transfected with control or MCCC1 siRNAs for 3 days. In the last 24 h, cells were transfected with empty pEGFP (as a “transfection/loading control”) + pEGFP-α-synuclein A53T. Levels of α-synuclein A53T are expressed as a ratio to GFP. N = 3. *p < 0.05 vs. control cells; two-tailed unpaired t-test. Autophagy activation by MCCC1 depletion in SH-SY5Y cells (f) and primary neurons (g). N = 3. ***p < 0.001 vs. control cells; two-tailed unpaired t-test. Long exposure (LE); Short exposure (SE). h Autophagic flux in mouse primary cortical neurons from mRFP-GFP-LC3 (tfLC3) transgenic mice. Representative confocal z-stack images (right panel) and total number of GFP/mRFP dots (autophagosomes) and mRFP-only dots (autolysosomes). In total, 25–35 cells analyzed per condition per experiment; two-tailed unpaired t-test. Scale bar, 10 μm. Data are presented as mean values ± SEM. Source data are provided as a Source data file.

