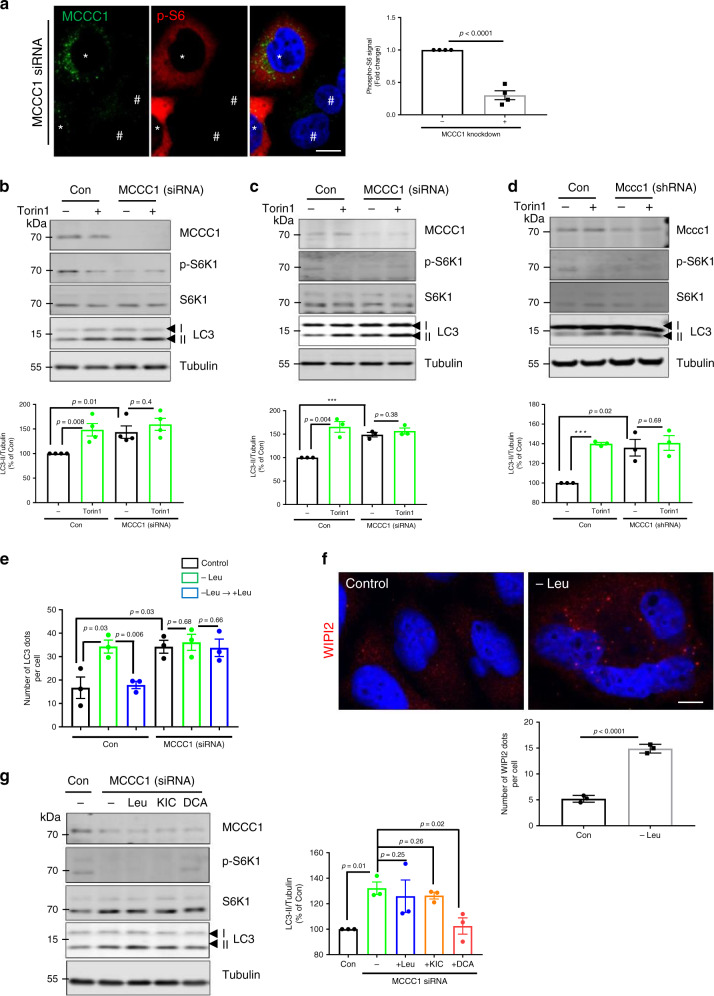
Fig. 2. MCCC1 knockdown induces autophagy by perturbing Leu metabolism which inhibits mTORC1.
a mTORC1 inhibition in MCCC1-depleted cells. HeLa cells were treated with MCCC1 siRNA and immunostained for MCCC1 (green) and phosphorylated S6 (red), nuclei were stained with DAPI (blue). For ease of visualization, the cell outlines are highlighted in white dashed lines. #MCCC1 knockdown cells, *non-knockdown cells. Scale bar, 10 μm. N = 4, 30–40 cells scored per condition per experiment. Two-tailed unpaired t-test. The effect of mTOR inhibitor Torin1 in MCCC1 knockdown HeLa (b) or SH-SY5Y (c) and Mccc1 knockdown primary neurons (d). Control and MCCC1 knockdown cells were treated with 0.5 µM Torin1 (or DMSO) for 4 h. N = 4 for HeLa cells or N = 3 for SH-SY5Y and primary neurons. ***p < 0.001 vs. control cells; two-tailed unpaired t-test. e Autophagy response to changes in Leu levels. HeLa cells were treated with scrambled siRNA or MCCC1 siRNA then incubated in Leu-depleted media for 4 h or incubated in Leu-depleted media for 4 h, followed by the re-addition of 10 µM of Leu to the media for 1 h. N = 3, 50–60 cells scored per condition per experiment. Two-tailed unpaired t-test. f Increased number of WIPI2 dots in Leu-depleted media. N = 3, 40 cells scored per condition per experiment. Scale bar, 5 μm. Two-tailed unpaired t-test. g Rescue of autophagy and mTORC1 activation in MCCC1 knockdown by dichloroacetate (DCA), not Leu or KIC. MCCC1 knockdown HeLa cells were treated with 10 µM Leu, 10 mM KIC, or 10 mM DCA for 1 h. N = 3. Two-tailed unpaired t-test. Data are presented as mean values ± SEM. Source data are provided as a Source data file.

