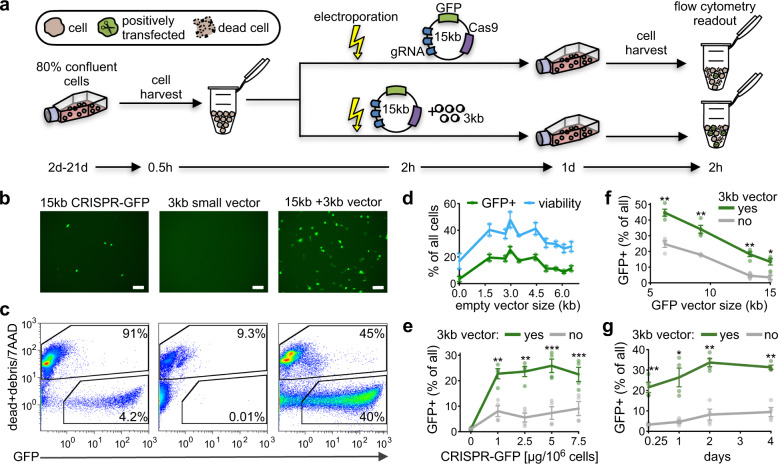
Fig. 1. Transfection efficiency can be improved by co-transfecting large CRISPR vectors with small vectors.
a Schematic overview of the cell transfection setting. Electroporation-mediated transfection (lightning bolt) of a large CRISPR-GFP vector (15 kb) without (above) and with (below) a small vector (3 kb). Duration in days (d) and hours (h) for each experimental procedure is indicated. b, c Microscopy images and flow cytometry plots (gating of GFP+ and 7AAD dead-cell marker) of hard-to-transfect A549 cells 24 h after electroporation (left: 15 kb CRISPR-GFP vector alone, middle: 3 kb small vector alone, right: co-transfection of 15 kb CRISPR-GFP and 3 kb small vector). Scale bar: 100 µm. Amounts of vector and electroporation conditions can be found in Table 1. d Line graph illustrates percent transfection efficiency (green) and cell viability (blue) upon co-transfection of a large 15 kb vector with small vectors of varying sizes (1.8–6.5 kb) in A549 and MCF7 cells (n = 4, mean ± SEM). e Line graph demonstrate the percent transfection efficiency after co-transfection of a large CRISPR-GFP vector (15 kb) of varying concentrations without (gray) and with (green) a small vector (3 kb) in A549 and MCF7 cells (n = 4, mean ± SEM). f Line graph demonstrate the percentage of viable GFP + cells after co-transfection of large GFP vectors (6.5–15 kb) without (gray) and with (green) a small vector (3 kb) in A549 and MCF7 cells (n = 4, mean ± SEM). g Line graph demonstrate the percent transfection efficiency after co-transfection of a large CRISPR-GFP vector (15 kb) without (gray) and with (green) a small vector (3 kb) in A549 and MCF7 cells from 6 h (0.25d) to 4d after transfection (n = 4, mean ± SEM). Statistics: paired two-tailed t-test, *p < 0.05, **p < 0.01, ***p < 0.001.

