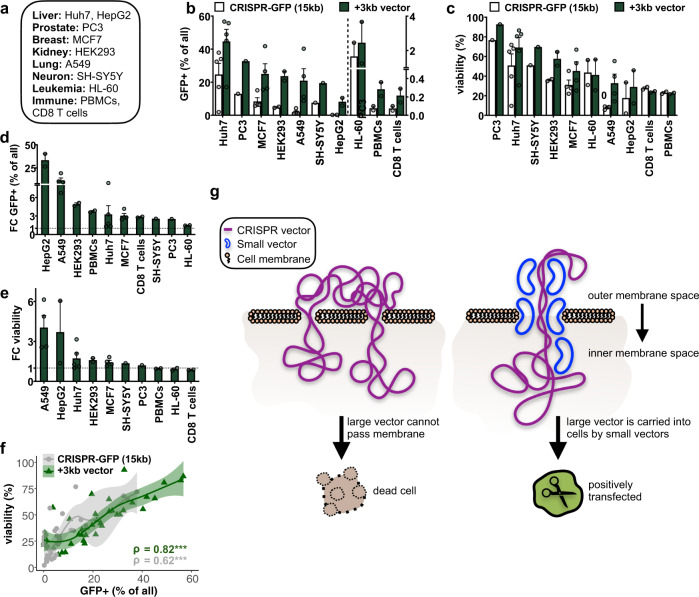
Fig. 2. Co-transfection of small vectors increases transfection efficiency in numerous cell types.
a Various human cancer cell lines and freshly isolated primary immune cells were electroporated. b, c Bar graphs depicting the percent increase of b transfection efficiency and c cell viability upon co-transfection of the CRISPR-GFP (15 kb) vector without (white) or with (dark green) a small vector (3 kb) in the tested adherent (left of the dotted line) and non-adherent (right of the dotted line) cells (n = 1–6, mean + SEM). Cell types are ranked by decreasing transfection efficiency or cell viability after adding the small vector. Amounts of vector and electroporation conditions can be found in Table 1. d, e Bar graphs illustrate the fold change (FC) in the number of d GFP+ and e viable cells after adding a small 3 kb vector ranked by FC-enrichment in the tested cells. f Plot shows Spearman’s rank correlation coefficients (ρ) and p-values (***p < 0.001) of transfection efficiencies (x-axis) and cell viability (y-axis) (in percent) without (gray) or with (green) co-transfection of a small vector (3 kb) (n = 26, 95% confidence interval). g Model explaining increased transfection efficiencies of large CRISPR vectors (purple) upon addition of small vectors (blue). Membranes and nuclear pores are coated by small vectors and thereby facilitates efficient delivery into the nucleus and subsequent molecular activity of the large vector.

