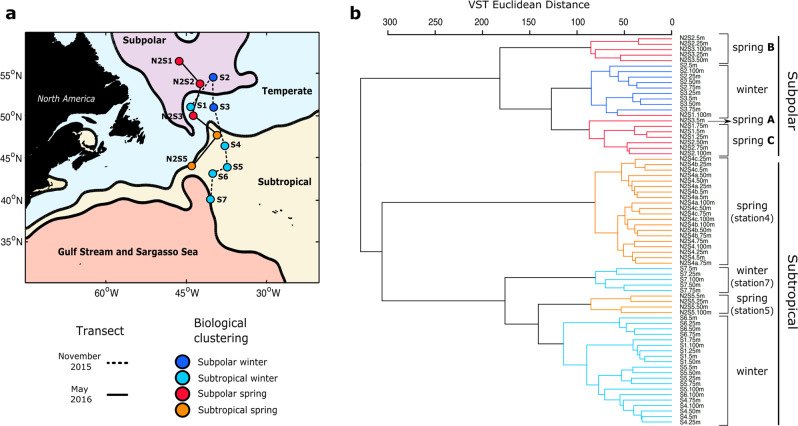
Fig. 1. Map of the sampled stations in the North Atlantic and hierarchical clustering of the samples based on the ASV profiles.
a Map of the western North Atlantic showing the subregions established by the mean dynamic topography analysis. Stations are indicated as circles. Those joined by a solid line were sampled in November 2015 (winter) and by a dashed line in the following spring (May 2016). Stations are color coded by the categorical sample assignments determined in the ASVs hierarchical clustering analysis as shown in (b): Subpolar winter, Subpolar spring, Subtropical winter, and Subtropical spring. b ASVs dendogram defined by hierarchical clustering of samples collected from the upper 100 m water column in winter and spring. Branches of the dendogram colored in navy blue and light blue represent samples collected in early winter from the Subpolar and Subtropical regions of the study area, respectively. Branches colored in red and cyan represent samples collected in the spring from the Subpolar and Subtropical regions, respectively. Within the subpolar category, three spring groups were defined. Spring ‘A’ represents the surface of the most southern subpolar station. Spring ‘B’ represents samples below the MLD at station 3 and above at station 2. Spring ‘C’ represents samples below the MLD at station 2 and above at station 1 (expanded in Fig. 2b).

