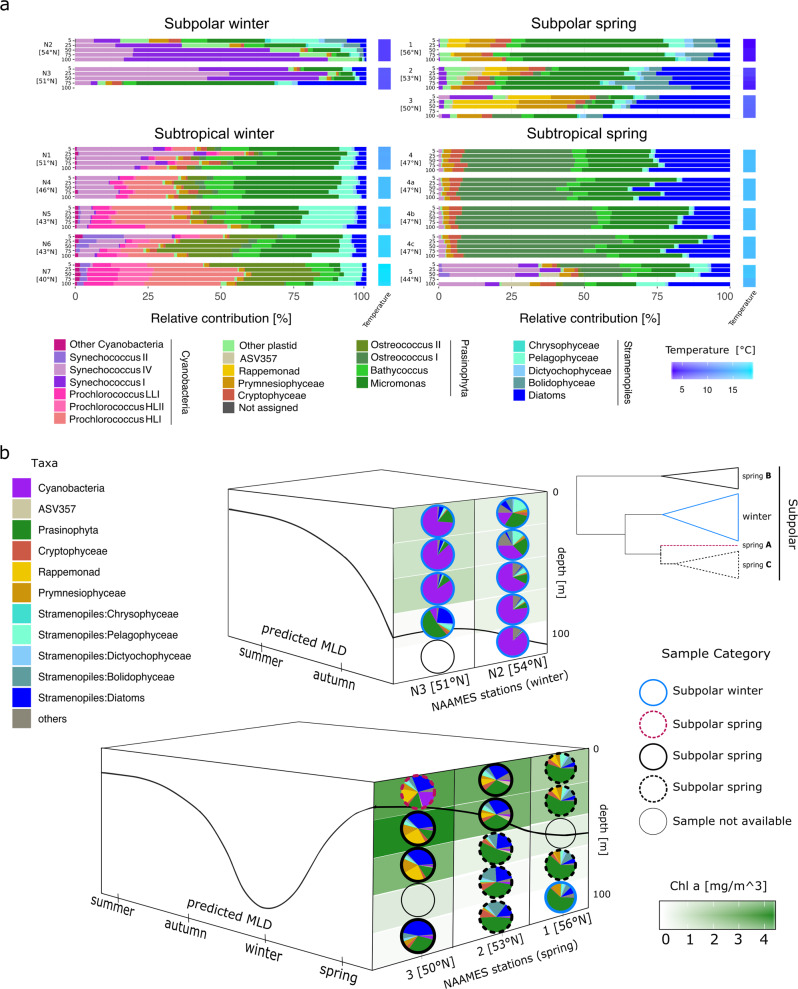
Fig. 2. Taxonomic and ecological description of the 16S rRNA phytoplankton amplicon datasets.
a Relative contributions of phytoplankton taxa for depth profiles at each station. Water column is represented by bars indicating five sampling depths (5, 25, 50, 75 and 100 m) and arranged from surface to deep samples. Stations are organized by the categories defined in the ASVs hierarchical clustering (Fig. 1b). Station 4 in the spring was occupied 4 days, capturing a rapid water column re-stratification event. These profiles are labeled as 4 (May 24), 4a (May 25), 4b (May 26) and 4c (May 27 2016). Water column temperature gradient is depicted as a heat map on the right side of each station bar plots. (b) Diagram depicting the spatio-temporal shifts in the subpolar region phytoplankton community composition, derived from phylogenetic taxonomic assignments. Top: vertical structure of community composition in November 2015, bottom: vertical structure of community composition in May 2016. Height of each box represents depth (0–100 m) and the solid black line represents the MLD. Left side of each box depicts the predicted annual dynamics of the mixed layer. Right side represents MLD (black line) and latitude, most southern in the front and most northern in the back. Vertical distributions of chlorophyll a concentration are represented by the background shades of green. Circle periphery of the pies identifies each sample to any of the defined subgroups from the ASVs hierarchical clustering analysis: winter, spring ‘A’, spring ‘B’ and spring ‘C’. A simplified representation of the ASVs clustering dendogram (subpolar section, Fig. 1b) is shown on the top-right corner.

