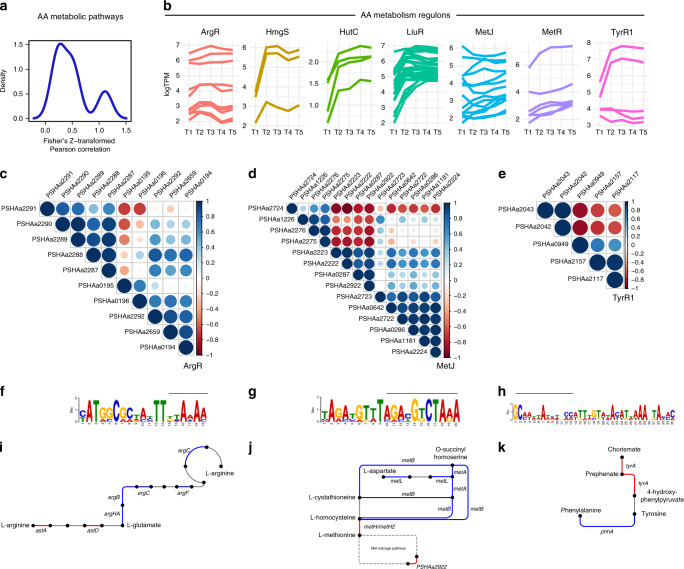
Fig. 3. Deregulation of amino acid metabolic pathways.
a Cumulative density plot of Fisher’s Z transformation average of Pearson correlation expressing the co-regulation of genes belonging to the same pathway. b Log2-transformed TPM values of the genes belonging to the same regulon. c–e Graphic representation of the Pearson correlation matrix for the genes belonging to the regulons showing the lowest average correlation, Arginine metabolism/biosynthesis, Methionine biosynthesis and Aromatic amino acids metabolism. Locus tags in bold indicate those of the regulator of the corresponding regulon. f–h Show the conserved upstream motif found for each gene of the considered regulon. The bar above each conserved motif indicates the overlap existing with the known TF binding site according to the RegPrecise database. Finally, in (i–k) the reactions encoded by the genes included in the same regulon are schematically represented. Red and blue lines schematically represent the correlation coefficient of Fig. 3c, d. Source data are provided as a Source Data file.

