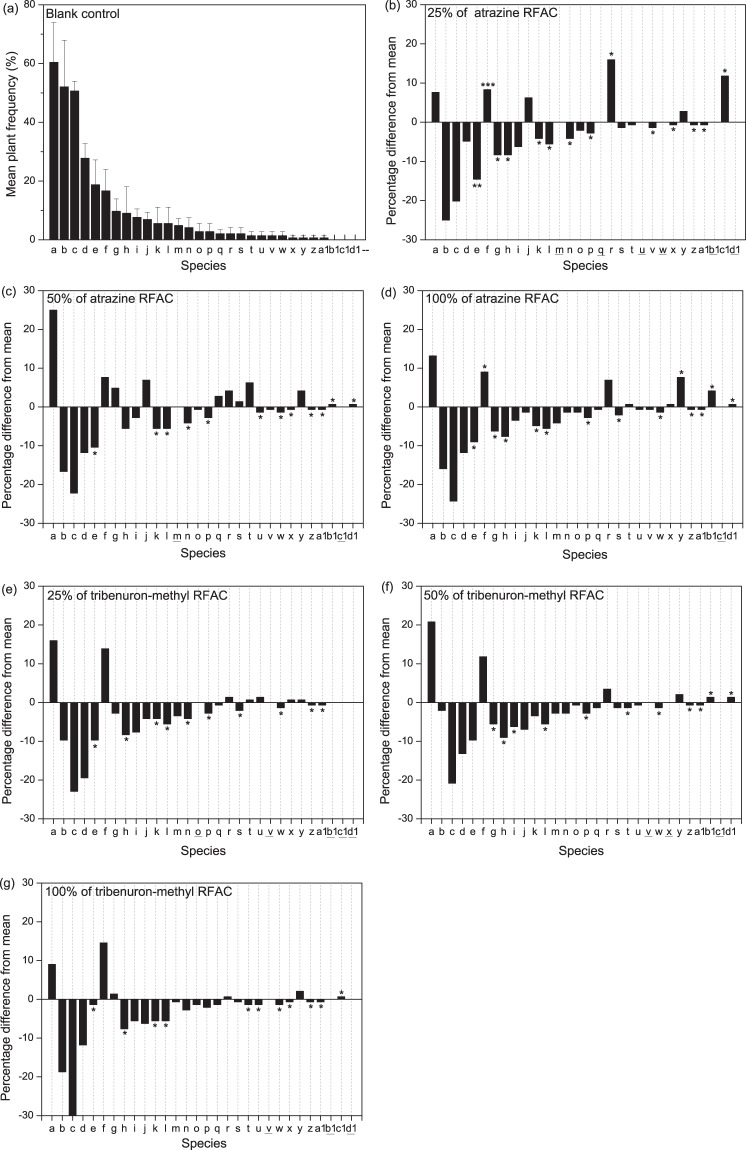
Figure 1.
Relative frequency of occurrence of 31 plants across the quadrats: (a) mean frequency of plant sample without herbicide; (b–g) the frequency of plant sample treated with herbicide compared with mean frequency of plant sample without herbicide. Note: data are the percentage of all quadrat cells in which the species was recorded in June, August, September, and October in 2014, 2015 and 2016. Here, and in Fig. 2, species codes are: a:Digitariasanguinalis; b:Amaranthusretroflexus; c: Chenopodiumalbum; d: Abutilon theophrasti; e:Setaria spp.; f:Calystegia hederacea; g:Setariaviridis; h:Acalyphaaustralis; i: Metaplexis japonica; j: Bidens spp.; k:Luffa aegyptiaca; l: Xanthium sibiricum; m:Brassica rapa var. oleifera; n: Portulacaoleracea; o-Ipomoea purpurea; p:Erigeron canadensis; q:Ixerispolycephala; r:Humulusscandens; s:Lactucaindica; t: Ambrosia artemisiifolia; u: Glycine soja; v-Eleusineindica; w- Picris japonica; x: Solanum americanum; y: Echinochloacrusgalli; z: Cyperusmicroiria; a1:Rorippaglobosa; b1: Ipomoea nil; c1:Cirsiumarvense var. integrifolium; d1:Capsella bursa-pastoris. The horizontal line under a letter indicates that the relative frequency of a species in this treatment did not change that of the blank control. *Indicates the significance of the difference between the frequency of different treatments and the frequency of blank treatments for each species according to the independent-sample ttest. *P < 0.05, **P < 0.01, and ***P < 0.001.

