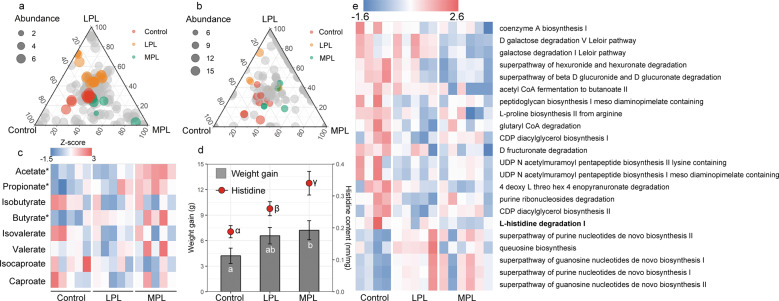
Fig. 3. Effect of different plant-based diets on Brandt’s vole.
Ternary plots showing the relative abundance of all gut microbial species (>5‱; a) function pathways (b) for control, LPL, and MPL groups. Each point corresponds to a species or one function pathway. The location of each point in the plot represents its mean relative abundance with respect to each diet group, and its size represents the mean value across all three groups. Colored points represent species or function pathways enriched in one diet group compared with the others (red in control, orange in LPL, and green in MPL samples). c Heat map indicating metabolite differences in short-chain fatty acids across L. brandtii consuming different diets. Metabolites with an asterisk represent significant differences between different diet groups. d Differences in weight gain and fecal histidine content across L. brandtii consuming different diets. e Marker pathways with significantly different abundances between precipitation treatment and control.

