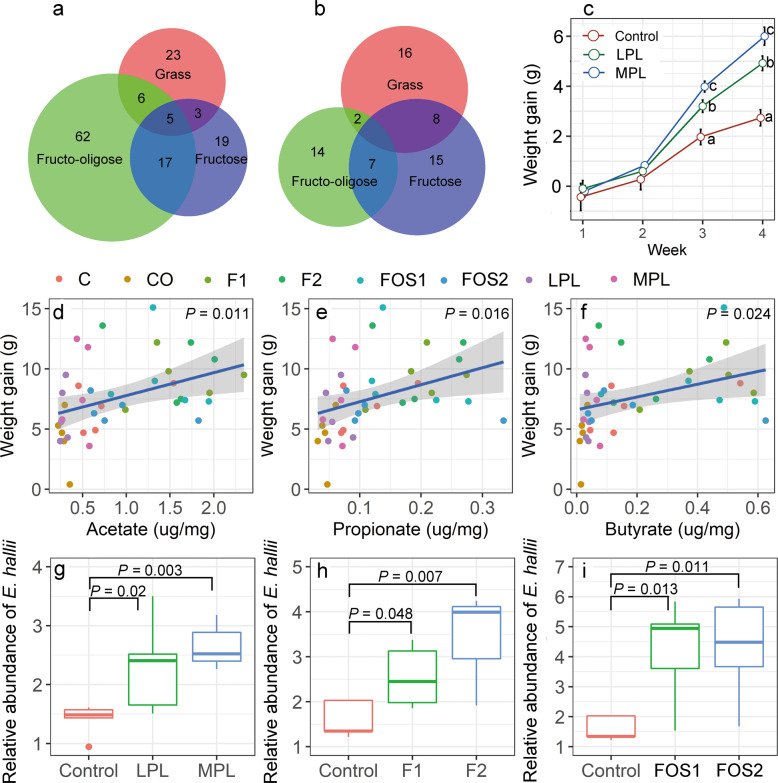
Fig. 6. Differences in the composition and function pathways between different experiments and their relationship with body growth of voles.
Venn diagrams showing the number of enriched microbial species (a) or enriched function pathways (b) shared by grass feeding, fructose addition, and FOS addition experiments. Body weight gain of voles who received feces from control, LPL and MPL donors, different letters indicate significant differences between the treatments (P < 0.05; c). The linear relationships between short-chain fatty acid contents and L. brandtii weight gain (d–f). The relative abundance of E. hallii across different diet groups (g–i).

