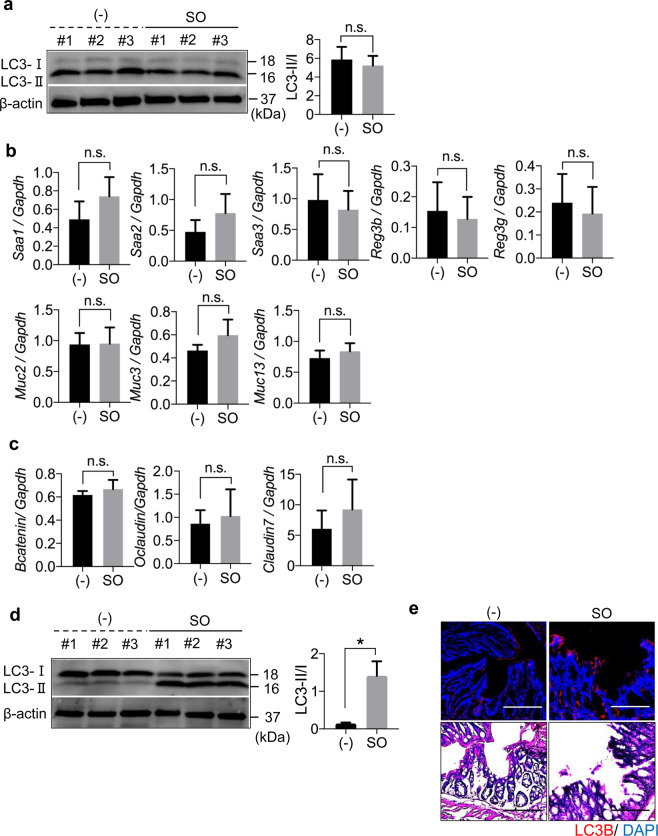
Figure 2.
SO did not induce autophagy in large intestinal epithelial cells in the steady state. (a) Activation of autophagy by SO in colonic epithelial cells was analyzed by measuring the ratio of LC3-II to LC3-I that detected by western blot analysis using the indicated antibodies. Conversion of LC3 in colonic epithelial cells from C57BL/6J mice administered SO in drinking water for 7 days. The ratio of LC3-II to LC3-I was measured with Image studio lite ver. 5.2 (Li-Cor Bioscience, Nebraska, USA). Full-length blots are shown in Supplementary Fig. S10a. (b,c) Expression levels of the indicated genes in large intestinal epithelial cells from mice treated or untreated with SO in the steady state. Data are mean ± SD from three independent experiments. Data were analyzed by unpaired t-test. n.s., not significant. (d) Conversion of LC3 in colonic epithelial cells from C57BL/6J mice administered DSS with or without SO in drinking water for 7 days. *P < 0.05. Full-length blots are shown in Supplementary Fig. S10b. All data are representative of three independent experiments. (e) Expression of LC3B in the colon of C57BL/6J mice administered 2% DSS with or without SO in drinking water for 7 days were analyzed with immunohistochemistry using anti-LC3B antibody (upper). Representative images of H&E staining (bottom). Data are representative of three independent experiments. Bars; 100 μm.

