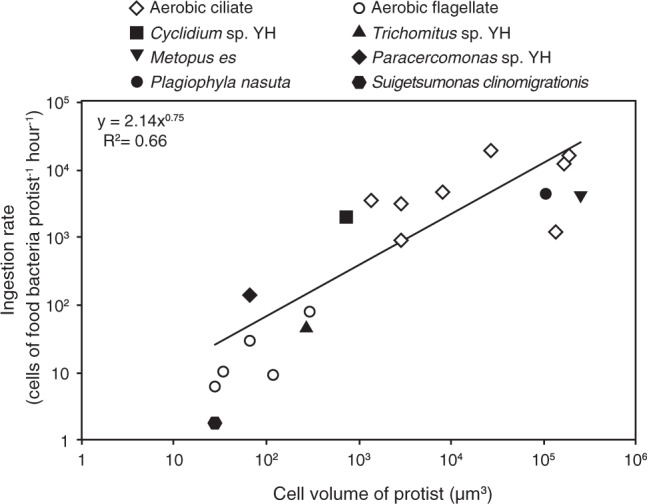
Fig. 6. Ingestion rate of various protists under high prey concentration (107 cells mL−1≤) against cell volume.

The plotted data are obtained this study and from the references listed in Table S2.

The plotted data are obtained this study and from the references listed in Table S2.