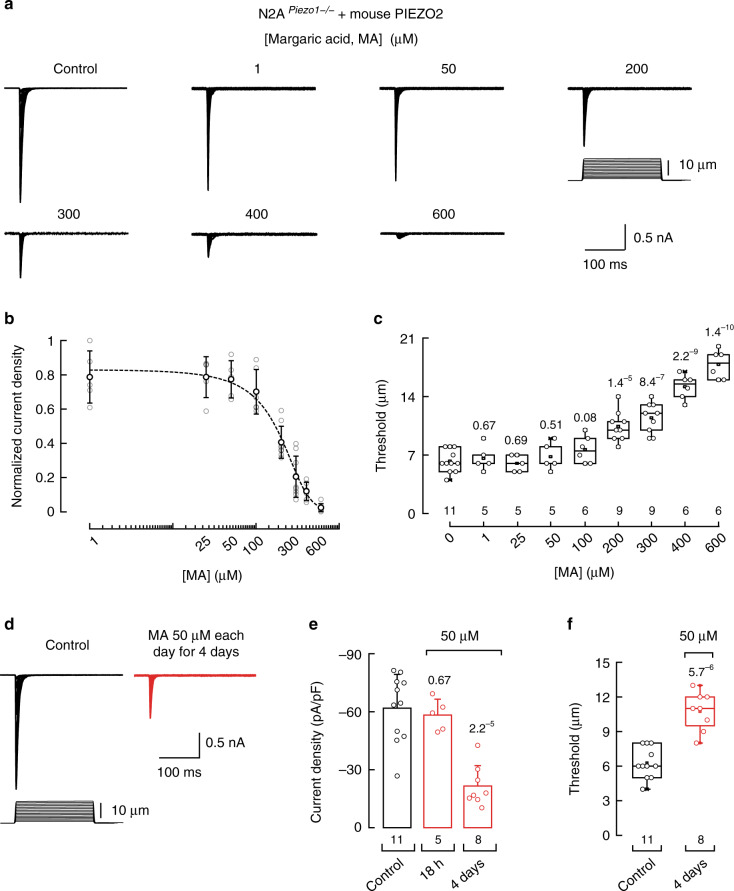
Fig. 1. MA inhibits heterologously expressed mouse PIEZO2 currents in N2APiezo1−/− cells.
a Representative whole-cell patch-clamp recordings elicited by mechanical stimulation (at −60 mV) of control and margaric acid (MA)-treated N2APiezo1−/− cells transfected with Piezo2 variant 2 (V2). b Normalized current densities elicited by maximum displacement of MA-treated N2APiezo1−/− cells transfected with Piezo2 V2. A Boltzmann function, Eq. (2), was fitted to the data (IC50 = 190.6 ± 14.7 SEM). Circles are mean ± SD. n is denoted above the x-axis of c. c Displacement thresholds required to elicit PIEZO2 V2 currents of control and N2APiezo1−/− cells. Boxplots show mean (square), median (bisecting line), bounds of box (75th to 25th percentiles), outlier range with 1.5 coefficient (whiskers), and minimum and maximum data points. n is denoted above the x-axis. Two-tailed unpaired t-test. d Representative PIEZO2 currents (at −60 mV) of control and MA (50 µM each day for 4 days)-treated N2APiezo1−/− cells transfected with Piezo2 V2. e PIEZO2 V2 current densities elicited by maximum displacement of control and MA (50 µM for 18 h and each day for 4 days)-treated N2APiezo1−/− cells. Error bars represent SD. n is denoted above the x-axis. Two-tailed unpaired t-test. f Displacement thresholds required to elicit PIEZO2 V2 currents of control and MA (50 µM each day for 4 days)-treated N2APiezo1−/− cells transfected with PIEZO2 V2. Boxplots show mean (square), median (bisecting line), bounds of box (75th to 25th percentiles), outlier range with 1.5 coefficient (whiskers), and minimum and maximum data points. n is denoted above the x-axis. Two-tailed unpaired t-test. p-values are denoted above the boxes and bars.

