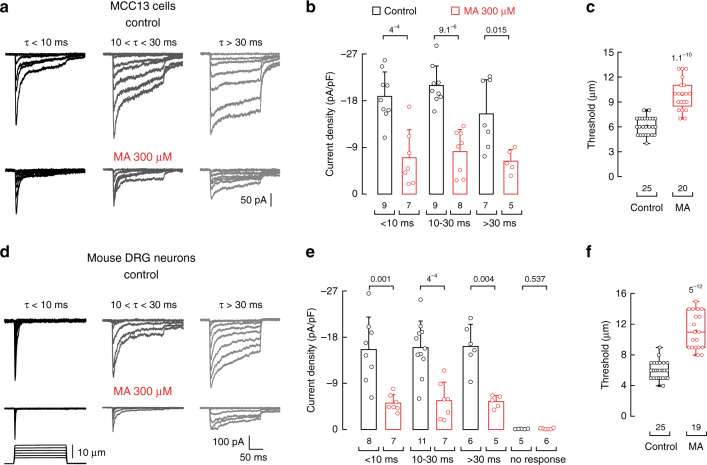
Fig. 3. MA decreases mechano-activated currents in MCC13 and mouse DRG neurons.
a Representative whole-cell patch-clamp recordings elicited by mechanical stimulation (at −60 mV) of rapidly (τ < 10 ms), intermediate (10 < τ < 30 ms), and slowly inactivating (τ > 30 ms) currents of control (top) and MA (300 µM)-treated (bottom) MCC13. b Current densities elicited by maximum displacement of control and MA (300 µM)-treated MCC13 cells. Bars are mean ± SD. n is denoted above the x-axis. Two-tailed unpaired t-test. c Displacement thresholds required to elicit mechano-currents of control and MA (300 µM)-treated MCC13 cells. Boxplots show mean (square), median (bisecting line), bounds of box (75th to 25th percentiles), outlier range with 1.5 coefficient (whiskers), and minimum and maximum data points. n is denoted above the x-axis. Two-tailed unpaired t-test. d Representative whole-cell patch-clamp recordings elicited by mechanical stimulation (at −60 mV) of rapidly (τ < 10 ms), intermediate (10 < τ < 30 ms), and slowly inactivating (τ > 30 ms) currents of control (top) and MA (300 µM)-treated (bottom) DRG neurons. e Current densities elicited by maximum displacement of control and MA (300 µM)-treated DRG neurons. Bars are mean ± SD. n is denoted above the x-axis. Two-tailed unpaired t-test. f Displacement thresholds required to elicit mechano-currents of control and MA (300 µM)-treated DRG neurons. Boxplots show mean (square), median (bisecting line), bounds of box (75th to 25th percentiles), outlier range with 1.5 coefficient (whiskers), and minimum and maximum data points. n is denoted above the x-axis. Two-tailed unpaired t-test. p-values are denoted above the bars and boxes.

