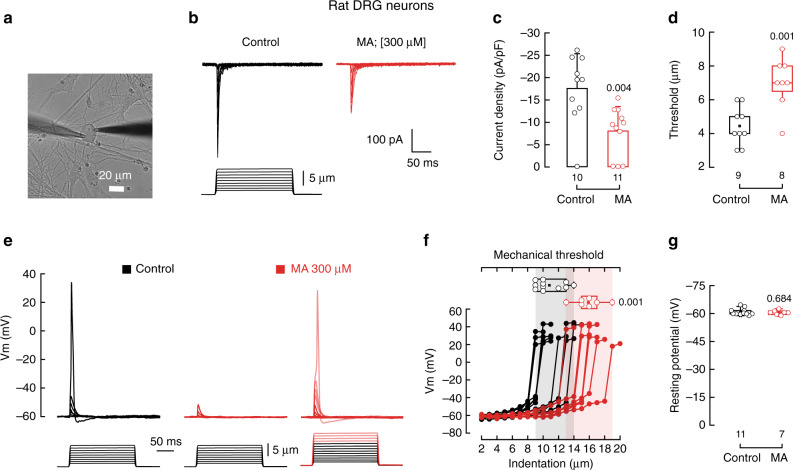
Fig. 5. MA decreases mechano-activated currents in rat DRG neurons.
a Micrograph showing a rat DRG neuron in the whole-cell patch-clamp configuration ready for mechanical stimulation. Micrograph is representative of at least 12 independent preparations. b Representative whole-cell patch-clamp traces of mechanically activated currents of control and MA (300 μM)-treated rat DRG neurons. c Current densities elicited by maximum displacement of control and MA (300 µM)-treated rat DRG neurons. Bars are mean ± SD. n is denoted above the x-axis. Two-tailed unpaired t-test. d Boxplots show mean, median, and the 75th to 25th percentiles of the displacement thresholds required to elicit currents of control and MA (300 μM)-treated rat DRG neurons. n is denoted above the x-axis. Two-tailed unpaired t-test. e Representative current-clamp recordings of membrane potential changes elicited by mechanical stimulation in control and MA (300 µM)-treated rat DRG neurons (up to 9 and 13 µm indentation, respectively). f Membrane potential peak vs. mechanical indentation of independent control (black; n = 11) and MA-treated (red; n = 7) rat DRG neurons. Top panel shows the displacement threshold required to elicit an action potential in these neurons. Boxplots show mean (square), median (bisecting line), bounds of box (75th to 25th percentiles), outlier range with 1.5 coefficient (whiskers), and minimum and maximum data points. Two-tailed Mann–Whitney test. g Membrane resting potential values recorded briefly after whole-cell current-clamp configuration was achieved from control and MA (300 µM)-treated rat DRG neurons. Error bars represent SD. n is denoted above the x-axis. Two-sided permutation t-test. p-values are denoted above the bars and right of the box.

