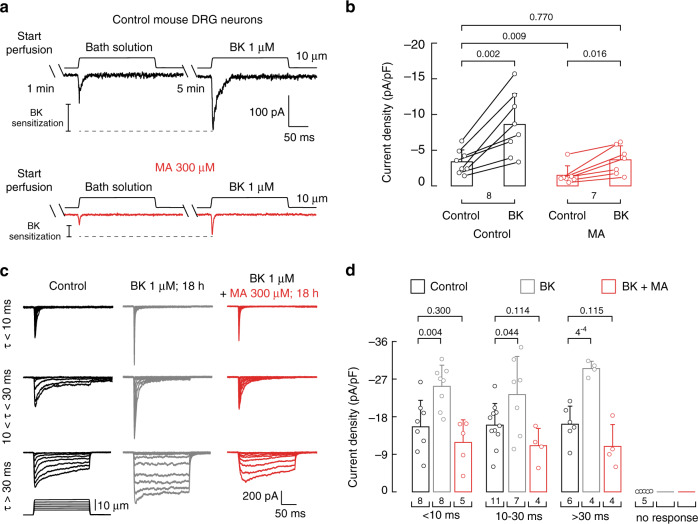
Fig. 6. MA recovers normal mechanical response in sensitized mouse DRG neurons.
a Representative whole-cell patch-clamp traces of mechanically activated currents after perfusing bath solution (60 s) and bath solution containing bradykinin (BK; 300 s; 1 µM) consecutively to control (black) and MA (300 µM)-treated mouse DRG neurons. b Current densities elicited by 10 µm displacement of control and MA (300 µM)-treated mouse DRG neurons perfused for with bath solution (60 s) and with bath solution containing bradykinin (BK; 300 s, 1 µM) consecutively. Bars are mean ± SD. Data samples are paired. n is denoted above the x-axis. Two-tailed paired t-test for untreated control before and after BK, two-tailed unpaired t-test for untreated control and MA-treated neurons after BK, two-tailed Mann–Whitney for untreated control and MA-treated control before BK, and two-tailed Wilcoxon matched-pairs signed-ranks test for MA-treated neurons before and after BK. c Representative whole-cell patch-clamp recordings elicited by mechanical stimulation (at −60 mV) of rapidly (τ < 10 ms), intermediate (10 < τ < 30 ms), and slowly inactivating (τ > 30 ms) currents of control (black), BK (gray; 1 µM for 18 h) and BK + MA (red; 1 µM and 300 µM, respectively, for 18 h)-treated mouse DRG neurons. d Current densities elicited by maximum displacement of mechanically activated currents elicited by mechanical stimulation (at −60 mV) of rapidly (τ < 10 ms), intermediate (10 < τ < 30 ms), and slowly inactivating (τ > 30 ms) currents of control, BK (1 µM; 18 h) and BK + MA (1 µM and 300 µM, respectively; 18 h both)-treated mouse DRG neurons. Bars are mean ± SD. Two-tailed unpaired t-test. n is denoted above the x-axis. p-values are denoted above the bars.

