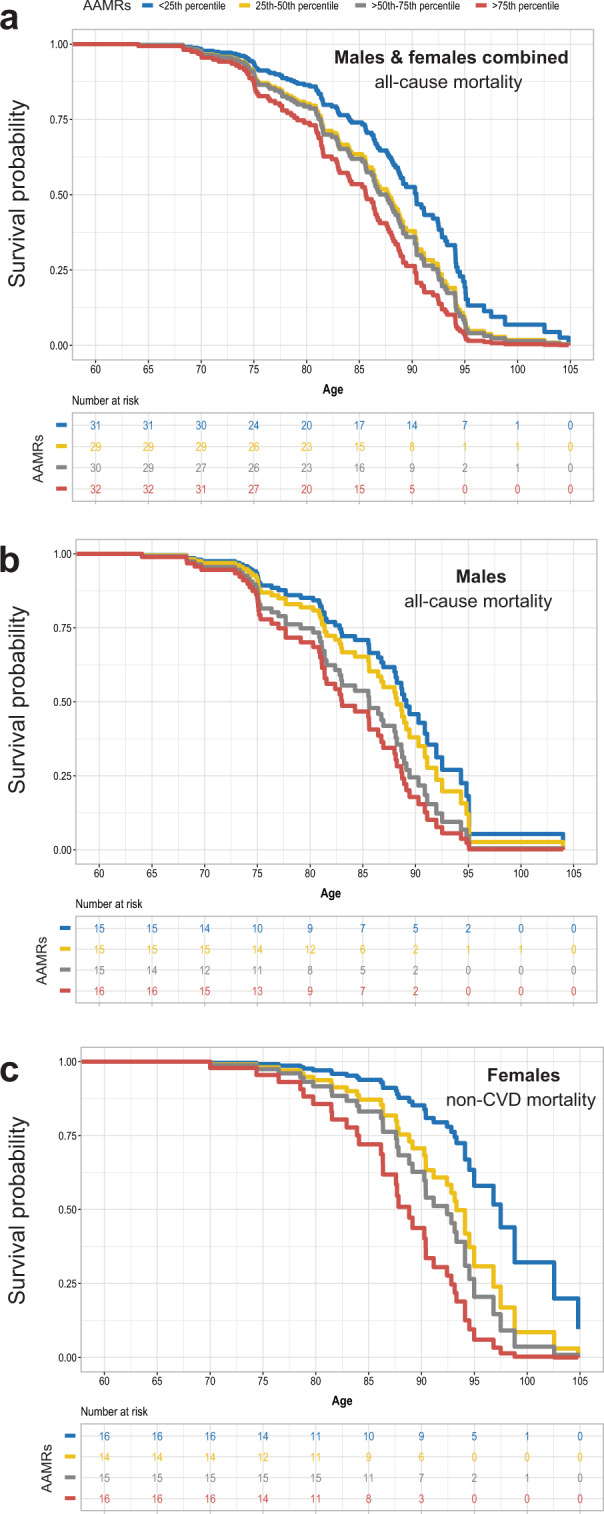
Figure 2.

Predicted survival curves by quartiles of age-adjusted germline mutation rates. Parental age and birth year were fixed to their median values (25 years and 1912, respectively) based on the fitted model in Table 1. (a) both sexes combined, all-cause mortality; (b) males only, all-cause mortality; (c) females only, non-cardiovascular disease (non-CVD) mortality. AAMRs: age-adjusted mutation rates, with quartiles color-coded as in Fig. 1.
