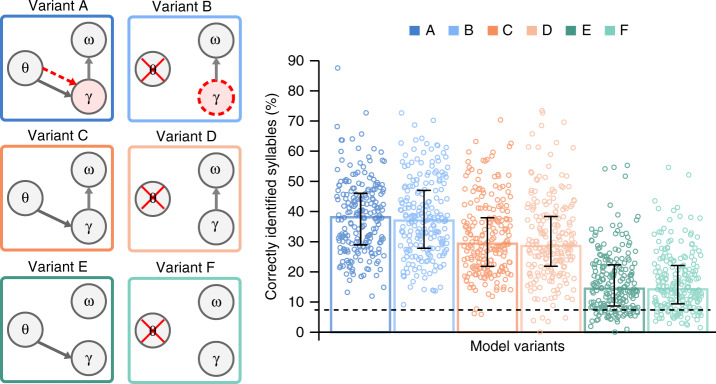
Fig. 3. Precoss model variants and their performance.
We tested the model’s performance for 6 different architectures (left panel). Columns (dark vs light colours, theta to gamma solid arrow) represent whether the model’s gamma (γ) activity is reset by theta (θ)—signalled onsets. Rows (differently coloured) correspond to whether syllable units (ω) are reset by the last gamma unit (γ to ω arrow, A, B and C, D) or not reset (E, F). Whenever the γ circle is coloured red, the corresponding model has a preferred rate for the gamma sequence (theta-gamma coupling; A and B). In A, the preferred gamma rate is dynamically set by the theta oscillation (red dashed line from θ to γ circle), hence it has exogenous theta-gamma nesting. Variant B has internally set preferred gamma rate value (dashed red gamma circle), hence endogenous theta-gamma nesting. The bar plots represent the median performance of each model configuration (n = 210 samples). The error bars show 25% and 75% percentiles; the dashed horizontal line indicates the chance level (estimated to be at 6.9%). Pairwise comparisons were performed using the Wilcoxon signed-rank test (2-tailed). p-values are given in the Supplementary Table 1. All comparisons except A vs. B, C vs. D and E vs. F are highly significant at a corrected alpha <10−7.

