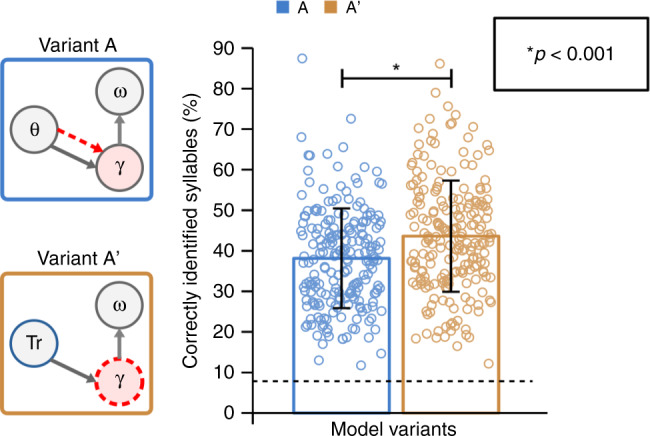
Fig. 6. Explicit versus theta signalled onsets.

The ideal onset detection condition is modelled by explicitly signalling true syllable onsets (denoted as Tr in blue circle for variant A’). Mean performance value (±s.d.) are shown for each model configuration (n = 210 samples). The dashed line on the bar plot corresponds to the chance level 6.9%. Model variant A’ (43.6% ± 13.7), based on variant B (hence features endogenous theta rhythm) with the addition of explicit onset information Tr to reset gamma sequence, performed better than the variant A (38.8% ± 12.13). Pairwise comparison was performed using the 2-tailed paired t-test (t-value=5.26, p = 3.63e-7, degrees of freedom=209, s.d.=15.01).
