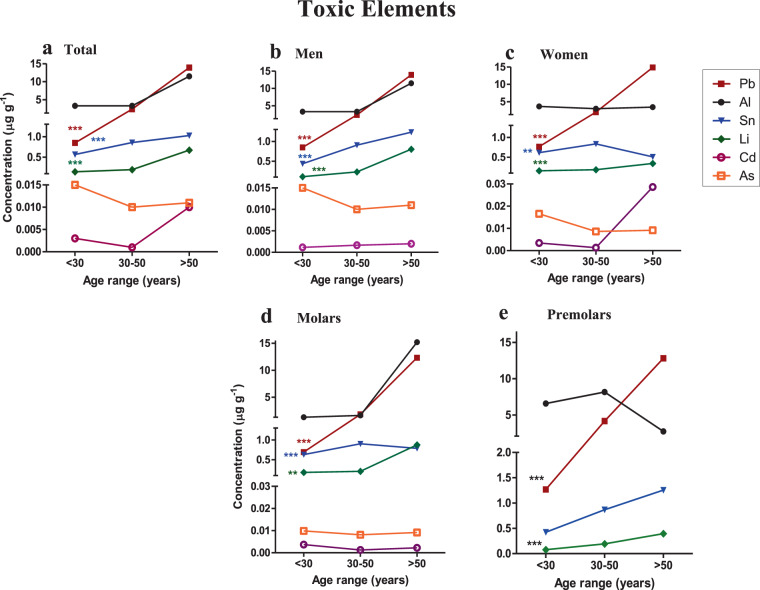
Figure 2.
Concentration of toxic elements in dentine and their relationship with age. (a) Concentration of toxic elements in all the teeth. (b,c) Concentration of toxic elements in men and women’s teeth. (d,e) Concentration of toxic elements in the different types of teeth. Each point represents the mean concentration value of each trace element. Comparisons between the different age ranges (<30, 30–50, >50 years) were made using the Kruskal-Wallis test. P < 0.05 was taken as statistically significant. *p < 0.05; **p < 0.01; ***p < 0.001. This figure has been generated using GraphPad Prism 5 software.

