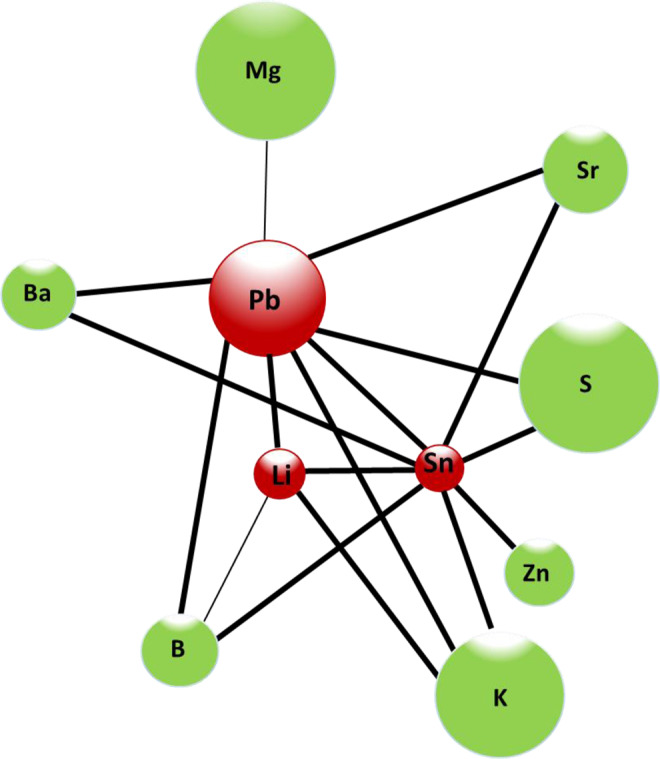
Figure 4.

Representative diagram of the positive correlations between the toxic and essential elements that increase their concentration with age in human teeth dentine. Green nodes indicate essential elements. Red nodes indicate toxic elements. The thickness of the line indicates the degree of correlation. Fine line indicates a correlation is significant at the 0.05 level (2-tailed) and thick lines indicate that the correlation is significant at the 0.01 level (2-tailed). The size of the nodes represents the mean of the concentration of the element.
