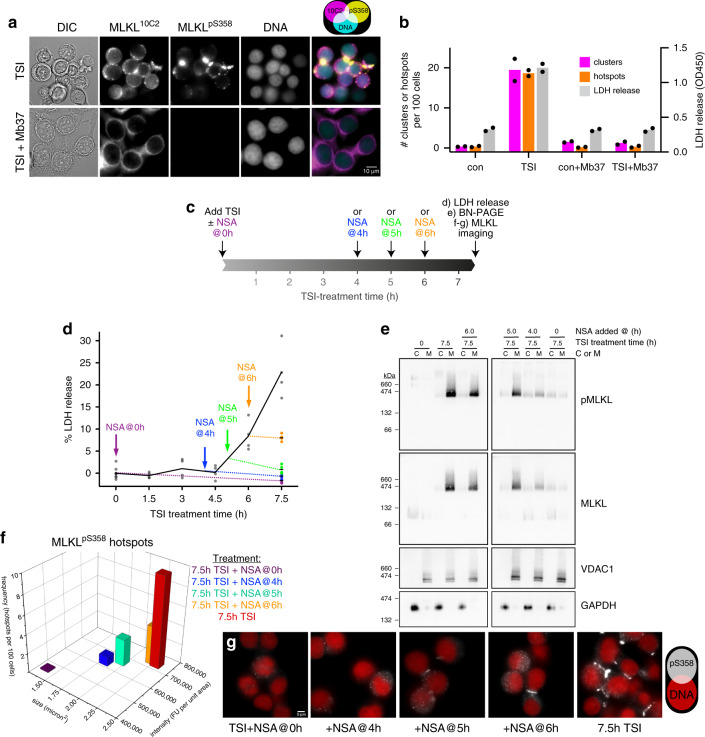
Fig. 3. Necroptosis relies on exceeding a threshold level of plasma membrane pMLKL.
a Images of TSI-treated HT29 cells expressing Mb37 stained for MLKL10C2, MLKLpS358 and DNA (Hoechst). b Mean frequency of clusters and hotspots from n = 2 independent experiments (N > 1500 cells per group) with raw lactate dehydrogenase (LDH) release values taken from the same samples. c–g Necrosulfonamide (NSA) was added to HT29 cells together with TNF, Smac mimetic and IDN-6556 (TSI) or 4–6 h after TSI addition. Plasma membrane lysis (LDH release; line shows mean of 4 biological replicates indicated as dots; data representative of n = 3 independent experiments) (d), MLKL activation (e) and hotspots (f, g) were measured after 7.5 h of TSI-treatment. e Cytosol (C) and membrane (M) fractions resolved by Blue Native-PAGE and immunoblotted for MLKL and MLKLpS358. Uncropped blots are included as Source Data. Fractionation was verified by probing for voltage-dependent anion channel 1 (VDAC1; membrane), glyceraldehyde-3-phosphosphate dehydrogenase GAPDH (cytosol); representative of n = 2 independent experiments. f Mean frequency, intensity and size of hotspots from one experiment (N = 1309-1740 cells per group); representative of n = 3 independent experiments.

