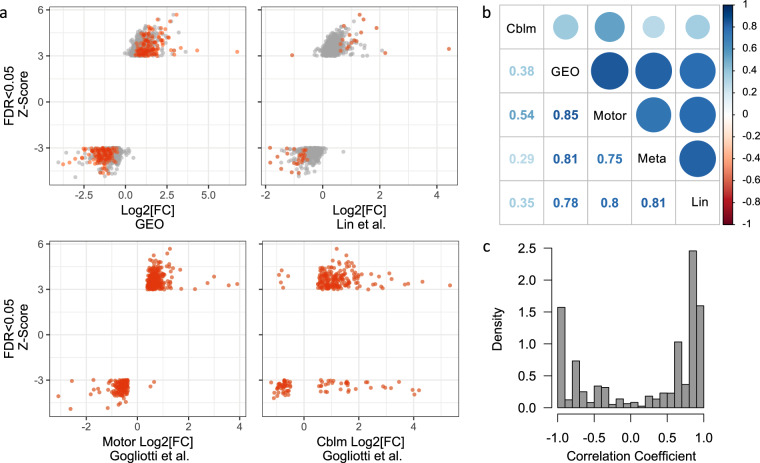
Fig. 5.
Replication of differential gene expression between RTT and CTL brain. (a) Meta-analysis Z-Score compared to log2 fold change (FC) between RTT and CTL from our initial analysis (GEO), Lin et al. combined frontal and temporal cortex (from Table S5)13, Gogliotti et al. motor cortex (from Table S2)14, and Gogliotti et al. cerebellum (from Table S3)14. Genes with significant differential expression (False Discovery Rate [FDR] < 0.05) in the dataset represented on the X-axis are in red. (b) Spearman’s correlation between meta-analysis Z-score and logFC for each of the other datasets. Color intensity and circle size are proportional to the correlation coefficients with values displayed below the diagonal. (c) Density of gene-wise correlation coefficients among datasets in (b).

