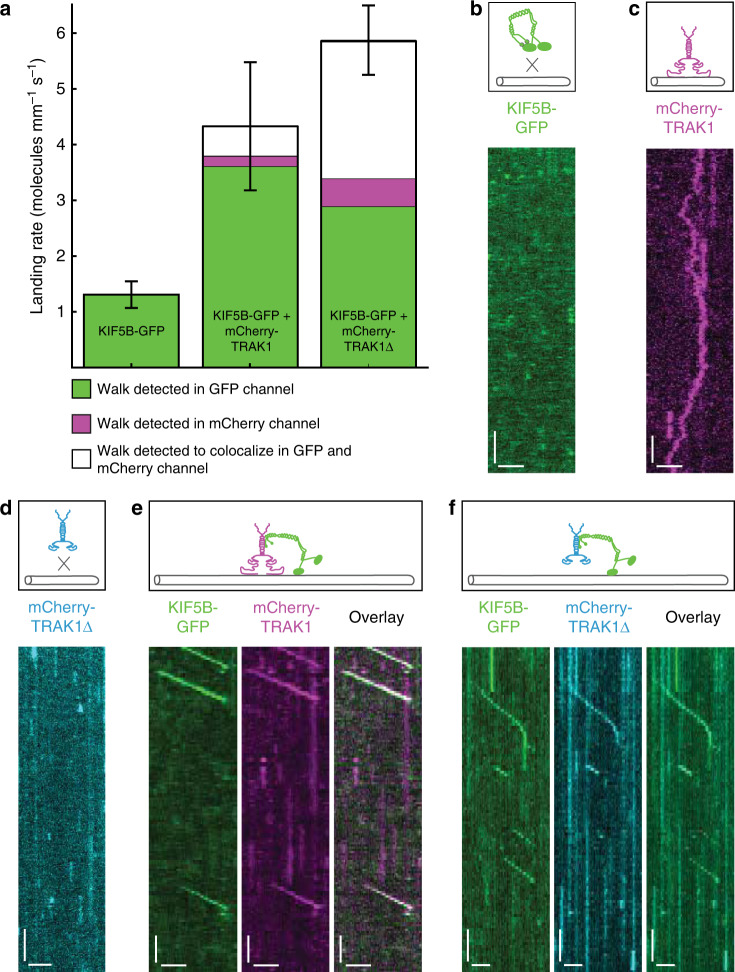
Fig. 1. TRAK1 activates KIF5B.
a Landing rates for processively walking KIF5B-GFP molecules alone (left, n = 87 molecules, N = 4 experiments), in presence of mCherry-TRAK1 (middle, n = 547 molecules, N = 4 experiments) and in presence of mCherry-TRAK1∆ (right, n = 308 molecules, N = 4 experiments), respectively, detected in the GFP channel (green), mCherry channel (magenta) or colocalizing in both channels (white). Data are presented as mean values ± standard deviation. Source data are provided as a Source Data file. Schematic illustrations and kymographs of b auto-inhibited KIF5B-GFP not interacting with the microtubule (experiment was repeated 60 times independently with similar results), c mCherry-TRAK1 diffusing along the microtubule (experiment was repeated 28 times independently with similar results), d mCherry-TRAK1∆ not interacting with the microtubule (experiment was repeated four times independently with similar results), e KIF5B-GFP (green) colocalizing with mCherry-TRAK1 (magenta) and moving processively along the microtubule and f KIF5B-GFP colocalizing with mCherry-TRAK1∆ (cyan) and moving processively along the microtubule. Horizontal scale bars 2 µm, vertical 5 s.

