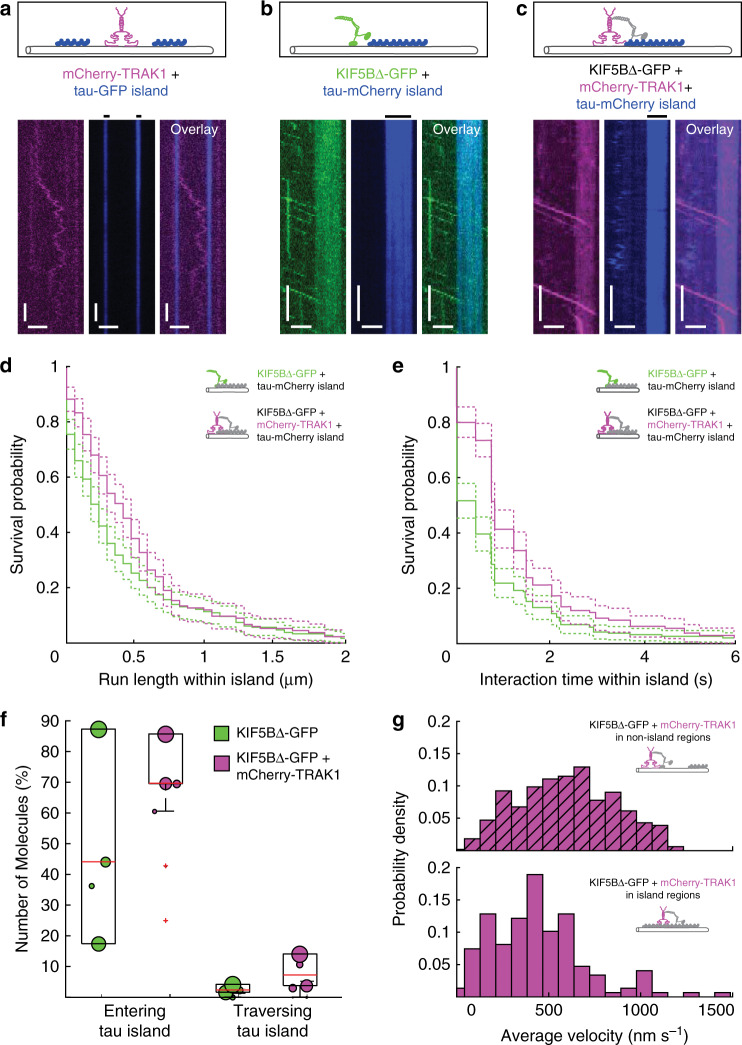
Fig. 3. TRAK1 promotes KIF5B processivity in cohesive tau islands.
Schematic illustrations and kymographs of a mCherry-TRAK1 (magenta) diffusing in non-tau island regions but not entering tau-GFP islands (blue), b processive movement of KIF5B∆-GFP (green) dissociating at the edges of tau-mCherry islands (blue) and c KIF5B∆-GFP in presence of mCherry-TRAK1 (magenta) penetrating into tau-mCherry islands (blue). The positions of the tau-mCherry islands are denoted by black horizontal lines. Horizontal scale bars 1 µm, vertical 5 s. The experiments were repeated 4 times independently with similar results d, e Survival probability plots showing the increased median run length and interaction time of KIF5B∆-GFP within tau-mCherry islands in presence of mCherry-TRAK1 (magenta) in comparison to KIF5B∆-GFP in absence of mCherry-TRAK1 (green) (p = 0.0141 and p < 10−4, respectively). Two-tailed p-values were obtained by a log-rank test. f KIF5B∆-GFP in presence of mCherry-TRAK1 (magenta, n = 202 molecules, N = 6 experiments) showed a higher probability to enter and traverse tau-mCherry islands than KIF5B∆-GFP alone (green, n = 240 molecules, N = 4 experiments). Red lines present the median values, top and bottom edges of the black boxes present upper and lower quantiles, whiskers present the highest/lowest data points and red crosses present outliers. Data points are weighted by the number of measurements. For island length distributions see Supplementary Fig. 3. g Histograms showing the average velocity of KIF5B∆-GFP-mCherry-TRAK1 complexes in non-island regions (magenta dashed, same dataset as in Fig. 2f) and within tau-mCherry islands (magenta, n = 148 molecules, N = 6 experiments). Source data are provided as a Source data file.

