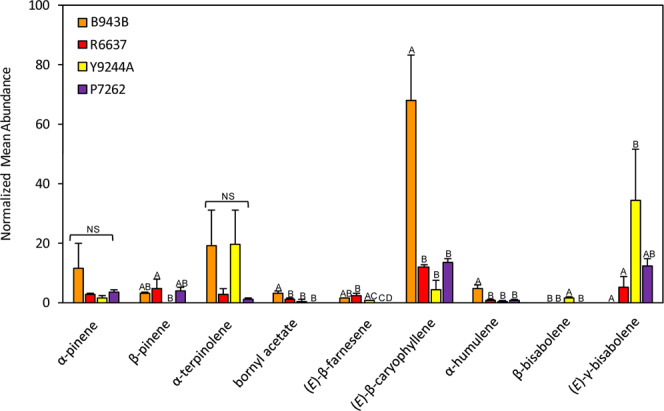
Figure 7.

Comparison of relative terpene levels for compounds identified by random forest analysis. Letters indicate significant differences determined by ANOVAs and post-hoc Tukey-HSD comparisons (conducted separately for each compound following a significant MANOVA). Yellow-Y9244A, Orange-B493B, Red-R6637 and Purple-Orange-P7262. NS, not significant. Error bars indicate standard deviation across three biological replicates (n = 3). Statistically significant differences were considered when p ≤ 0.05 with α = 0.05.
