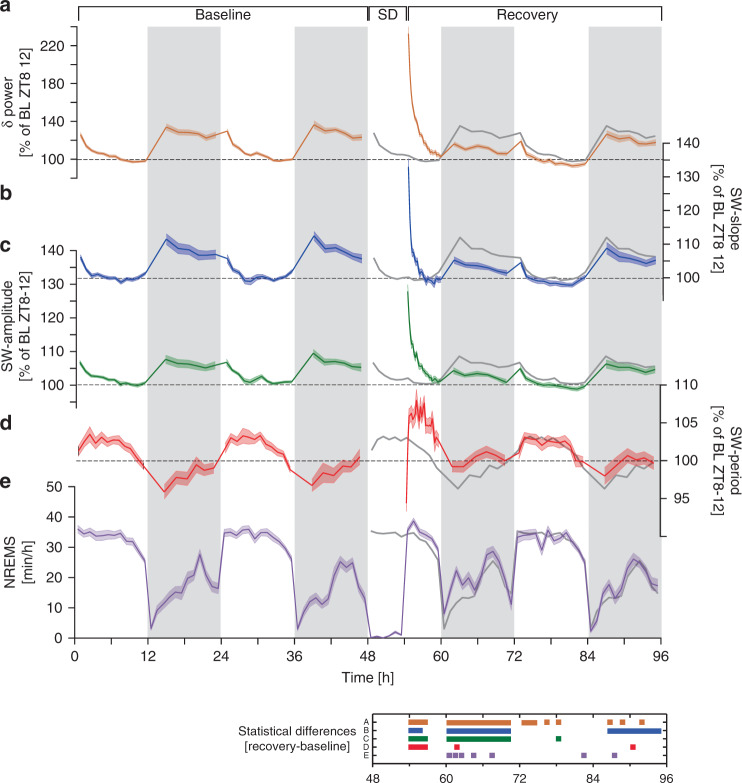
Fig. 1. Frequency- and time-domain analysis of SWs before and after sleep deprivation.
a Relative changes in δ-power (0.75–4 Hz) followed sleep-wake distribution (see e) and were highest after sleep deprivation (SD; 48–54 h; two-way rANOVA factors SD x time: F34,1836 = 115.3, p < 1.0E-17). b SW-slope and c SW-amplitude followed nearly identical patterns (two-way rANOVA factors SD x time; SW-slope: F34,1819 = 45.2, p < 1.0E-17; SW-amplitude: F34,1819 = 61.6, p < 1.0E-17) although their dynamic range was smaller because power scales as a square to amplitude. d Dynamics of SW-period differed from the other three variables and was at times in opposition (two-way rANOVA factors SD × time: F34,1819 = 8.3, p < 1.0E-17). Data in a–d represent quantiles [light (12), dark (6), and recovery day 1 light (25)], containing equal numbers of NREMS 4-s epochs, respectively, and were referenced to their respective lowest values reached in baseline (two-day mean of last 4 h of light period). e NREMS time-course expressed as min h−1 of recording. NREMS increased during recovery compared to baseline (two-way rANOVA factors SD × time: F34,1836 = 3.1, p = 1.1E-08). All values represent mean ± s.e.m (shading); a, e n = 38, b–d n = 37. Averaged baseline values (Baseline days 1–2) are re-plotted during recovery for comparison (dark-gray line). Significant post-hoc recovery-baseline differences (p < 0.05) are presented in a color-matched panel (a–e refer to figure panels) below. Note that SW-power, -slope, and -amplitude all fall below baseline during the 1st recovery dark phase. Data are derived from fronto-parietal bipolar EEG signals.

