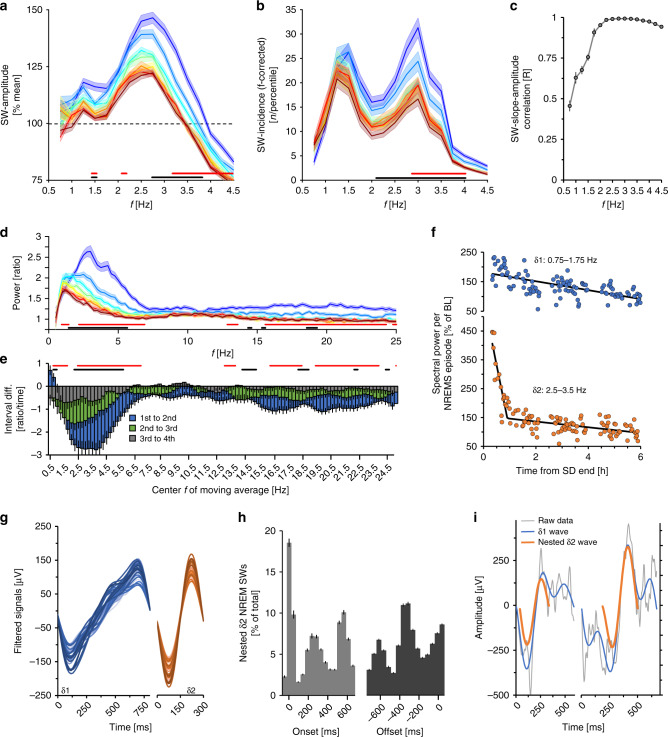
Fig. 2. Evidence for two distinct δ-bands.
Distribution of a SW-amplitude and b SW-incidence according to SW-period (frequency; 0.25 Hz bins) during recovery (REC). The 1st 6 h of recovery were divided into 25 NREMS quantiles (7.0 ± 0.1 min NREMS/quantile), the dynamics of the 1st eight are depicted (≈ first 2 h). SW-incidence was corrected for frequency (n Hz−1) because slower SWs cannot physically occur as often as faster SWs. c SW-slope to -amplitude correlations during the same time were highest in faster frequencies. d Relative spectral power during the 1st 2 h of recovery, displays not only a significant decrease in power, but a shift from faster to slower frequencies. Significant differences between the 1st/2nd (two-way rANOVA factors quantile × frequency: F98,7252 = 8.65, p < 1.0E-17) and 2nd/3rd quantiles (F98,7252 = 2.08, p = 3.24E-09), though not after 3rd/4th (F98,7252 = 1.13, p = 0.18). e Ratios of five 0.25 Hz-bin moving averages between spectra in the 1st–2nd, 2nd–3rd, and 3rd–4th time quantiles in d. Note that lower frequencies initially increase (two-way rANOVA factors quantile difference × frequency: F99,7326 = 9.13, p < 1.0E-17). f Time-course of δ1- and δ2-power during the 1st 6 h of recovery per NREMS episode in one representative mouse. Symbols represent mean power reached in consecutive episodes. g Average waveforms of detected δ1- (blue) and δ2 (orange)-waves during the 1st 10 min of recovery NREMS following SD, for individual mice (n = 37). h Timing of nested δ2-waves relative to δ1-onset (left) or -offset (right; 0 ms indicates onset and offset, respectively). Histograms span 50 ms time-bins plotted at midpoint. Of note, the 2nd and 3rd histogram peaks indicate the starts of these additional nested δ2-waves (n = 37; one-way rANOVA factor time-bin; δ2-onset: F15,540 = 305.2, p < 1.0E-17; δ2-offset: F15,540 = 327.4, p < 1.0E-17). i Example of a δ2-wave (orange) at onset (left) or during (right) a δ1-wave (blue). Unfiltered signals are presented in gray. Values are mean ± s.e.m. indicated as either error bars or shaded areas. In a, b, and d significant changes between 1st–2nd and 2nd–3rd quantiles are indicated with red and black bars, respectively.

