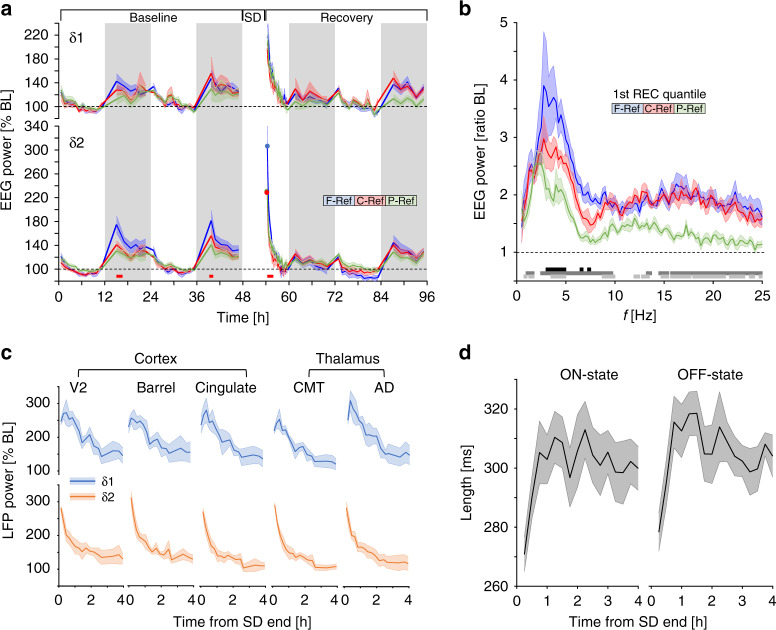
Fig. 4. δ2-dynamics are visible throughout the thalamus and cortex.
a Time-course of δ1- (upper) and δ2-power (lower graph) at different cortical surface sites. δ2 is high at specific times during baseline (dark period) and following SD, and was highest in frontal areas, whilst derivation did not affect δ1 (δ2: 2-way rANOVA factors site × frequency bin: F168,1008 = 1.7, p = 1.0E-6). Circles denote initial values following SD for δ2 to emphasize frontal dominance in rebound. Red squares denote post-hoc significance between F-Ref and C-Ref/P-Ref. b EEG spectra differed across recording site during initial recovery NREMS (two-way rANOVA factors site × frequency bin: F196,1470 = 1.44, p = 2.0E-4). Black, dark gray, and light gray lines in lower panel represent post-hoc significant differences (p < 0.05; Tukey) between F–C, F–P, and C–P, respectively (n = 6). c LFP recordings following 4 h SD in multiple brain structures showed similar dynamic changes in both δ1- and δ2-power as in a. d Average length of ON- (left) and OFF- (right) states during the 1st 4 h of SD recovery as in c in the cingulate cortex shows immediate decreases after SD end (one-way rANOVA factor time; ON-state: F15,45 = 5.39, p = 0.00001; OFF-state: F15,45 = 7.06, p = 1.5E-07). Values are presented as means ± s.e.m.

