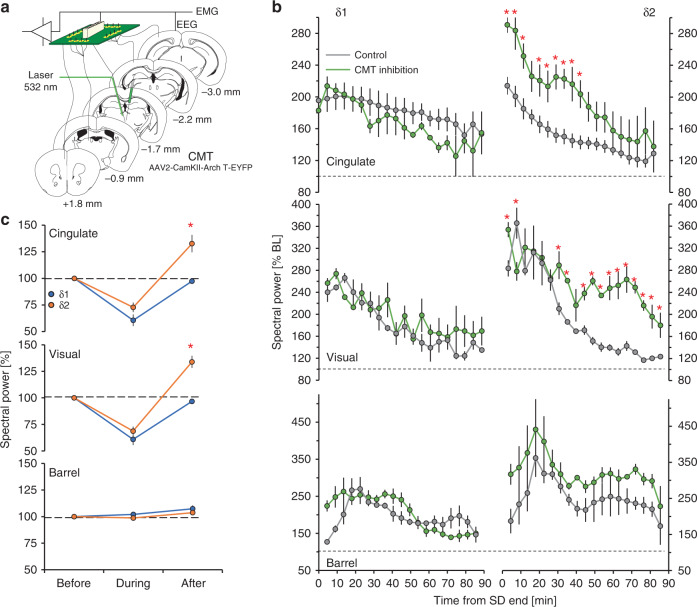
Fig. 5. Thalamic silencing alters δ2-dynamics in cingulate and visual cortex.
a Schema showing optogenetic inhibition of the CMT. Certain elements were re-used from a previous publication by the same authors30. b increased δ2-power (right) during NREMS (green) following a 4-h SD in the cingulate (top) and visual (middle) cortices, but not the barrel cortex (bottom) as compared to control SD animals (gray) (two-way rANOVA factors silencing × time; cingulate: F18,108 = 2.4, p = 0.003; visual: F18,108 = 4.7, p = 1.8E-07). δ1-power (left) was unaffected in all structures by CMT silencing. c Mean δ1- and δ2-power in these structures in baseline before, during, and after 10 s optogenetic silencing during NREMS of ArchT-expressing CMT neurons (one-way rANOVA factor ‘silencing’; cingulate: F1,8 = 73.7, p = 3.0E-4; visual: F1,8 = 48.4, p = 1.0E-4). Red asterisks denote significant post-hoc differences from controls (p < 0.05). Values are expressed as mean ± s.e.m.; in b n = 4, in c n = 6.

