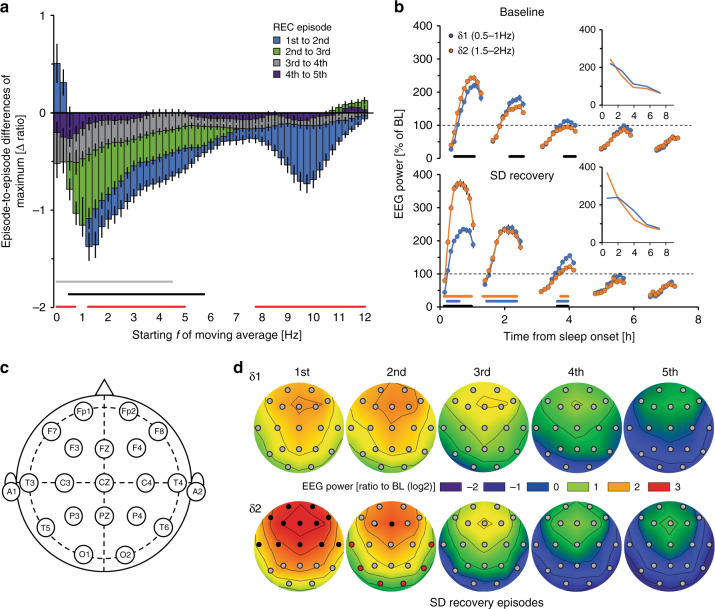
Fig. 6. δ-band heterogeneity in humans.
a Differences between consecutive recovery (REC) NREMS episodes in highest EEG power reached per episode [three 0.25Hz-bin moving average per quantile; see B; 1st–2nd (blue), 2nd–3rd (green), 3rd–4th (gray), and 4th–5th (dark blue)] following a 40-h sleep deprivation (SD). The largest decrease was observed in faster δ (1.5–2.0 Hz), while activity in slower δ (0.5–1 Hz) increased initially (two-way rANOVA factors episode-to-episode differences × frequency: F48,10464 = 13.6, p = 1.0E-17, n = 110). Red, black, and gray lines represent post-hoc significance (p < 0.05), 2nd/1st, 3rd/2nd, and 4th/3rd NREMS episode, respectively. Data is expressed as means ± s.e.m. b Time-course plots of δ1- (0.5–1.0 Hz) and δ2- (1.5–2.0 Hz) power during each NREMS episode (10 quantiles/episode) in baseline conditions (BL; top) and recovery (bottom). Gaps reflect intervening wake or REMS. During BL, significant δ1-δ2 differences were seen (two-way rANOVA factors sub-band × time-course: F49,10437 = 8.6, p = 1.0E-17). After SD, δ2 was increased during the first NREMS episode, illustrated by the time-course of maximum values per episode (insert; REC: two-way rANOVA factors sub-band × time-course: F49,10437 = 33.6, p = 1.0E-17). δ1-δ2 differences were seen during both BL and recovery periods (two-way rANOVA factors SD × time-course; BL: F49,10486 = 4.1, p = 1.0E-17; REC: F49,10388 = 29.2, p = 1.0E-17). Black lines represent post-hoc significance (Tukey) between quantiles of δ1 and δ2, blue and orange between δ1 and δ2 from baseline to recovery, respectively. Values are given as percentage of baseline mean ± s.e.m. (black lines; n = 110). Data are based on the right frontal-parietal derivation (F4-P4). c, d Electrode placement, and heat plots in a subset of subjects (n = 21) with 19 electrode sites, of δ1- and δ2-power during REC. Increases in δ2 were highest in frontal areas and dissipated more quickly in subsequent NREMS episodes than δ1 (two-way rANOVA factors electrode site × sub-band; 1st NREMS episode: F18,576 = 5.7, p = 1.6E-12; 2nd: F18,648 = 4.3, p = 8.2E-09). Values are expressed as log2 of ratio to mean BL power across all electrode sites, for each subject. Black and red filled circles represent electrode sites where δ2 was significantly higher and lower, respectively, than δ1 (Tukey post-hoc p < 0.05). Black contour lines are fixed at 0.5.

