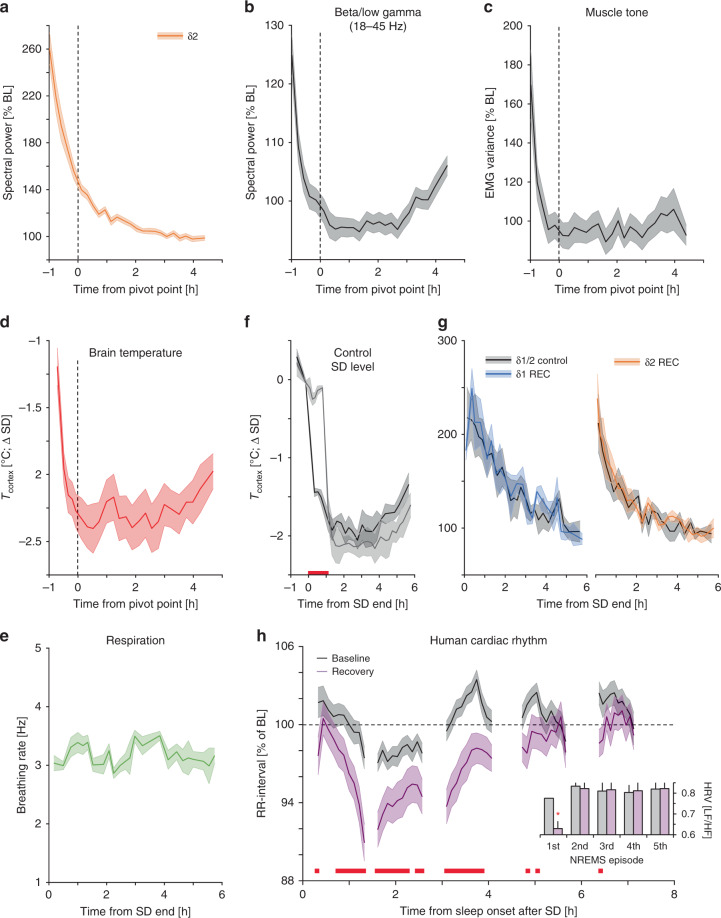
Fig. 7. δ2-dynamics typify a physiologically different NREMS sub-state.
a δ2-power declines across the 1st 6 h of recovery as does b EEG power in higher frequencies (beta/low-gamma: 18–45 Hz), c muscle tone, and d brain temperature (Tcortex), but not (e) respiratory rate. Of note, beta/low-gamma power was greater following SD than at any point during baseline (Supplementary Fig. 6f). f, g Experimentally maintaining Tcortex at sleep deprivation (SD) levels during the first hour of recovery (REC) in a subset of mice (n = 4), did not alter δ1- or δ2-dynamics. h Human cardiac rhythm (measured as RR-intervals expressed as percentage of mean baseline (BL) RR-interval (1.07 ± 0.02 s)) differed early in NREMS during recovery compared to baseline, as well as subsequent episodes (two-way rANOVA factors condition x time-course: F49,3822 = 1.8, p = 0.001), which was also reflected in heart rate variability (insert: HRV quantified as the LF/HF-ratio (see Methods); two-way rANOVA factors condition × time-course: F4,312 = 6.7, p = 0.008]. All values are mean ± s.e.m. and post-hoc significance (p < 0.05) is denoted with red lines (or asterisk; H-insert). Vertical dashed lines in a–e represent average of individually calculated δ2 pivot-points. a–c (n = 38), d (n = 8), e (n = 3), f, g (n = 4), h (n = 44).

