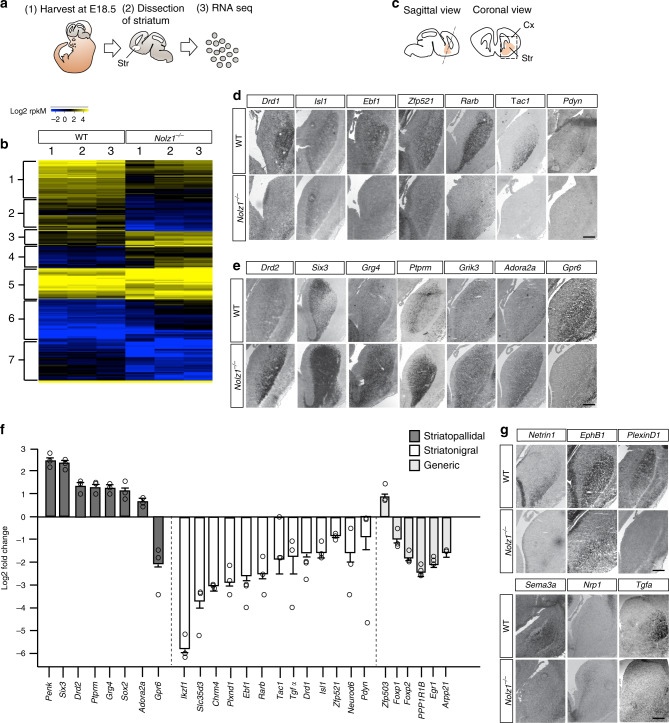
Fig. 3. Striatonigral to -pallidal switch of projection neuron identity in Nolz1−/− mutant striatum.
a Schematic outline of dissection followed by RNA sequencing analysis of Wt and Nolz1−/− mutant striatal tissue. b Heatmap showing differentially expressed genes in the E18.5 Wt and Nolz1−/− mutant striatum (n = 3 biologically independent samples). Upregulated genes are shown in yellow and downregulated genes in blue. Hierarchical clustering indicates that clusters 1, 2, 5b and 5c represents striatonigral and clusters 3, 4, 5a and 5e striatopallidal selective genes. c Schematic representation of section plane used to obtain coronal sections through the striatum of E15.5 embryos. d–e Analysis of differentially expressed genes in E15.5 Wt and Nolz1−/− mutant striatum by in situ hybridization validating the transcriptomic analysis. Striatonigral markers are downregulated (d) and several striatopallidal-specific markers are upregulated in Nolz1−/− mutant striatum (e). f A selection of striatopallidal, striatonigral and generic projection neurons markers that are differentially expressed between Wt and Nolz1−/− mutant striatum as identified by RNA sequencing. Graph represents fold change gene expression values in Nolz1−/− mutant striatum relative to Wt (n = 3 biologically independent samples). Expression values are presented as mean ± standard error log2 transformed values. g Expression validation by in situ hybridization of identified axon guidance molecules in E15.5 Wt and Nolz1−/− mutant striatum. Data are representative of three independent experiments (d, e, g). Scale bar (d, e, g): 200 μm. str (striatum), cx (cortex). Source data are provided as a source data file.

