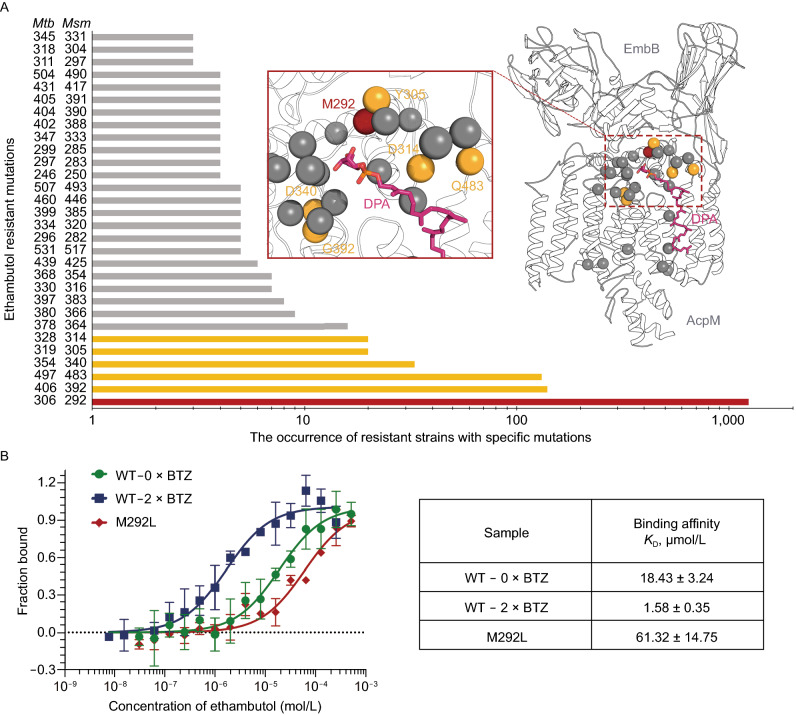
Figure 7.
Mapping of ethambutol-resistant mutation sites. (A) Log-Scaled histogram of the occurrence of the top 30 frequent ethambutol-resistant mutations in EmbB in 61 studies collected from the drug-resistance database, MycoResistance, and their positions on the DPA-bound EmbB structure, most notably around DPA binding cavity. Mutations with more than 20 occurrences are colored in yellow, and those with more than 1,000 occurrences are in red. (B) MST assays for the binding of ethambutol to wild-type EmbB treated with 2× MIC of BTZ-043 or inhibitor-free during culture and ethambutol resistant mutation hotspot M292L represented by red sphere in (A). Error bars represent mean ± SEM based on three independent measurements. Binding curves and KD values are also shown. See also Figs. S7 and S8

